General Program Operation
GIS Section
The geographic information system (GIS) defines the following functionality:
- Backdrop imagery in the form of raster data files (bmp, png, jpg, tiff)
- Vector displays using ESRI shapefiles MapInfo mapfiles or Planet legacy vector files
- Elevation and clutter views of the underlying terrain
Site and Link lists
The site and link lists represent the user’s data. As a minimum, a site is defined by its name and geographic coordinates and a link is defined by the end site identities. The user interface is the site list from which data can be imported by any of the following means:
- Text files containing a list of sites
- Text files containing a list of links (two sites per line)
- Existing Pathloss data files (pl6, pl5, pl4)
- An ODBC interface to an existing database
Links and sites can be exported to a database using the ODBC interface or to a text file.
Network Display Operations
The following design operations are carried out in the network display:
Automated link design for point to point and point to multipoint systems is implemented in the variants listed below. Design optimization and rejection criteria are used to determine the final configuration.
- Generate point to point link designs between any combination of sites in the network display including all sites to all sites
- Generate point to multipoint links from a base station to any combination of remote sites.
- Design point to point or point to multipoint links for a user specified connectivity.
- Modify existing links for different equipment, design criteria and specific calculation algorithms.
Local studies provide circular signal strength and line of sight displays centered on base stations.
An area study defines a common area for all base stations. The signal strength from each base station is calculated over this area. In addition to the signal strength displays, carrier to interference, most likely server and simulcast time delays displays are available in an area study
Pathloss 6 Integrated Link Design
When the user left clicks on a link in the network display, a drop down menu appears showing the following link design modules of the integrated link design program:
Transmission Analysis
This section calculates the link performance in terms of multipath, rain and obstruction fade probabilities. Data entry forms and lookup tables are provided for radio, antenna and transmission line equipment. An automated link design feature is also available in this section.
Terrain Data
Terrain profiles can be generated manually or from digital terrain elevation and clutter data. All distances, elevations and clutter heights can be edited. Structures, both on and off path and ranges of structures can be added to the path profile.
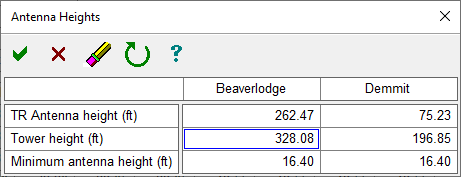
Antenna Heights
Antenna heights can be set to meet user specified clearance criteria. The analysis is extended to show diffraction loss at the minimum expected value of K and a user specified value. The feasibility of links operating in the VHF and UHF bands can be quickly determined with this feature.
Multipath - Reflection Analysis
Terrain reflections and ducting are analysed using ray tracing and reflective plane techniques. Receive signal variations are analysed as a function of K, antenna heights, frequency and tide levels. An interactive display is used to calculate the optimum antenna spacing to minimize the effects of a specular reflection on space diversity systems. Elevated and surface duct characteristics are automatically determined for the specific path profiles using the ITU-R P.453.8 database
Diffraction Loss
Diffraction loss can be calculated as a function of K, frequency, antenna heights and distance along the path profile. The OHLOSS report in this section provides the long term statistical variations diffraction and tropospheric scatter loss. Calculations can be made using any combinations of the algorithms in an interactive manner in order to verify questionable results.
Data Entry
In addition to the standard windows dialog boxes, the program uses two data entry forms. The standard data entry form is used for a fixed number of entries. The grid data entry form is used for a variable number of items. These are described below.
Standard Data Entry Form
Set the focus to the desired cell with a left click or use the cursor / tab keys and enter the data.
Cells which cannot be accessed are shown in blue letters. This may be a calculated field or not editable for some reason.
 |
Click the green check (OK) to close this form and accept the data entries |
 |
Click the red X (Cancel) to close this form and reset all data to their values on entry. |
 |
Click the Eraser button or press the F3 key to remove a data entry. If the button is inhibited, that data entry can only be modified but not removed. |
 |
Click the Reset button to change a data item back to its original value on entry. |
 |
Click the Help button to provide context sensitive help on the subject of this form. |
To edit an existing entry, select the field and press the F2 key or double click on the cell.
On forms with two columns, a data entry can be copied from one side to the other. Select the field to copy to and press the F4 key.
When units are applicable to a data entry, the required units will be specified. These are based on the global measurement setting. On items with feet or meter units, such as the tower height, the value in the opposite system can be entered using the following formats:
- The required units are meters. The data units are in feet. Enter the value followed by the letter ‘f’’ (e.g. 100f)
- The required units are feet, The data units are in meters. Enter the value followed by the letter ‘m’ (e.g 30.5m)
 Grid Data Entry Display
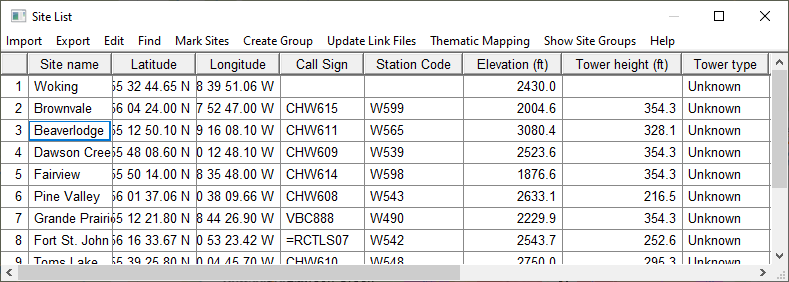
The grid data entry display is used when a variable number of entries is required such as the site list in the network display or in a lookup table. The following data types are used: numeric, text, boolean (e.g horizontal or vertical polarization), drop down lists, check boxes, and color definitions.
To enter data or replace existing data, set the focus to the desired cell with a left click or use the cursor / tab keys and enter the new data.
To edit existing data, double click on the cell or set the focus to the desired cell an press the Enter or F2 key.
Each data record has a minimum data entry requirement. For example in the case of a new site, the minimum requirement is the site name and the latitude - longitude.
Records can be edited and added using a list form. To edit an existing record, first select the record and then select the Edit - Edit menu item from the menu bar. Alternately, right click on the field in the record and select Edit from the popup menu.
To add a new record, select the Edit - Add menu item. An existing item can be used as a template for the new record. Left click on the record number field to select the item to be used as a template. Then select the Edit - Add menu item.
The list form may contain additional fields which are not available in the grid data form. For example, in the Site list form, the following additional fields are available: projected coordinates, address, city, state, country and owner code.
The records in most grid data forms can be sorted. Click the header of the field to sort. Alternate clicks sort the list in an ascending and descending order.
To change a column width, click on the column separator on the header bar and drag to the new width.
To change the column order, click on the column on the header bar and drag to the new location.
To reset the display to the default column widths and order, select the i menu item.
Right button menu
A right button click on a cell brings up a popup menu. The default menu selection consists of the edit list form and delete items; however, on others considerable functionality is available. An example of this is the DEM File index grid data entry form.
Text File Import
The import text file utility is used throughout the program for such tasks as importing site data and importing an index of backdrop files. A four step procedure is used for the import. The procedure starts by opening the text file to be imported. In the procedure below a site text file is used as the example.
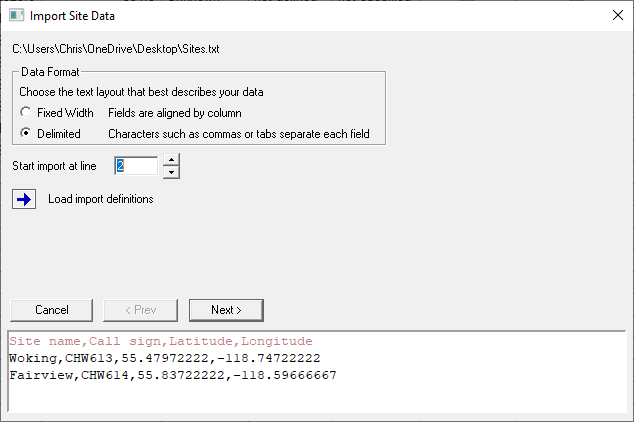
Step 1
The first 8 lines of the text file are initially displayed. If the file contains headers or other information before the import data, use the Start import at line up-down control to move the first line to be imported to the top of the display.
Select either the Fixed width or Delimited data format. In a fixed width file, a field will always start in the same column in the record. In a delimited file, the fields are separated by a delimiter character such as a comma or a tab.
When the text import is complete, all of the settings and column definitions used for this particular data import are automatically saved. The next time this particular text import is used, the previous settings will be automatically applied. The automatic save is made in the PL60.ini file located in the users AppData\roaming directory.
If various formats are being used for this particular import, the definition file can be saved in its own file in Step 3. Click the Load import definitions button to load an import definition file (id5 file).
Click the Next> button to proceed to Step 2.
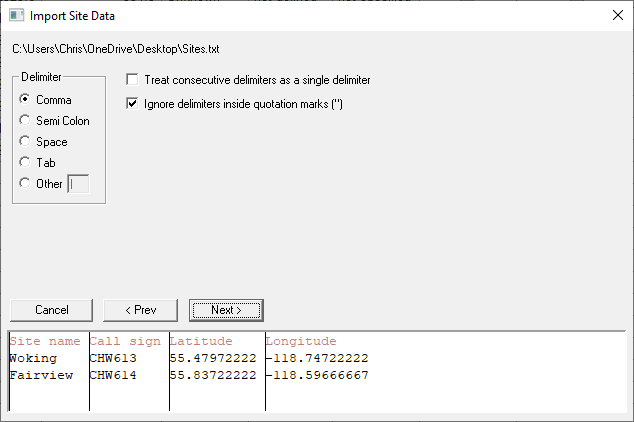
Step 2
For delimited files, specify the delimiter character. The display will be reformatted to show the field separations. Two additional options are used in delimited files:
- Treat consecutive delimiters as a single delimiter. This option may be necessary when a space is used as a delimiter.
- Ignore delimiters inside quotation marks. This option allows a delimiter character to be used in a string.
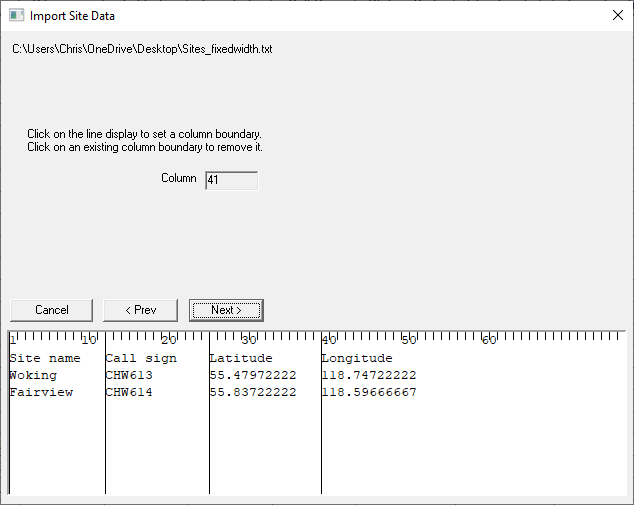
In a fixed width file, the user must define the start of each column. Left click on the display to set the column. Left click on an existing column to remove it
Click the Next> button to proceed to Step 3

Step 3
The columns are defined In this step. Initially all columns will be marked <none> meaning that these columns will not be used in the import. Click on a column to select it. Then select the column definition from the list above.
On delimited text files, click the Reset column widths to display headers button to resize the columns.
Click the Save import definitions button, to save all settings and column definitions in a separate file (id5 file)
When all columns have been defined, click the Finish button to complete the import.
Color Ramp
Color ramps are used for the following:
- Elevation backdrop
- Color coding links in Auto Link Design
- Signal level displays in local and area studies
This section describes the basic operation using the elevation color ramp as an example.
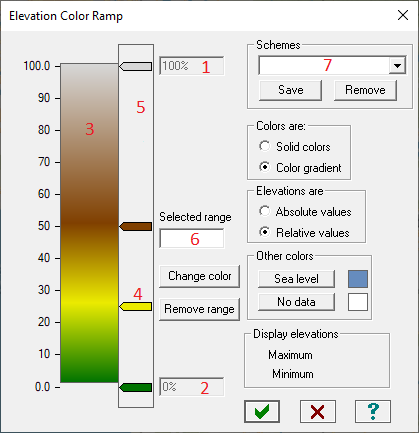
Absolute - relative values setting - In the example display, the elevations are set to relative values. The total range indicated by (1) and (2) are 100% and 0% and cannot be edited. For absolute values, enter the high end of the range in (1) and the low end of the range in (2).
Move a range by either method below:
- Click on the range marker (4) to hilite it. The value will be shown in the selected range edit control (6). Enter the new value and press Enter.
- Click on the range marker (4) and drag the marker up or down to its new location. You can drag the marker over other markers but be careful not to drag the marker out of the range column as this will delete the marker.
Add a new range by double clicking on a blank spot in the range column (5) outside the existing range markers.
Remove a range by either method below:
- Click on the range marker (4) to hilite it then click the Remove range button.
- Click on the range marker (4) and drag the marker outside the range column.
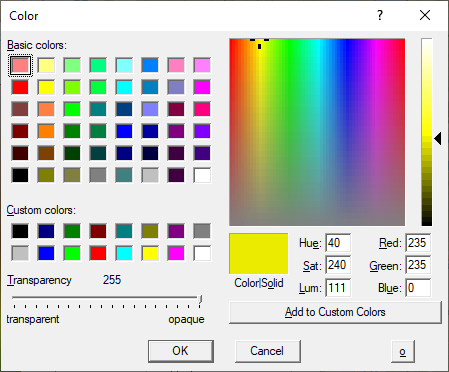
To change the color of a range, select the range marker (4) and click the Change color button or double click on the range marker. If the ranges use solid colors, then you can also change the color by double clicking on the range display color (3). Note that the color selection dialog includes a transparency setting. This feature can produce interesting effects for signal coverage and elevation backdrops.
Color schemes
Color schemes can be saved. The last scheme used becomes the default. To save a color scheme, enter a name for the color scheme (7) and click the Save button. To remove a color scheme, select the scheme from the drop down list and click the Remove button.
Antenna Configuration
 All calculations and analysis in the program are based on an antenna configuration. The following terminology describes the antenna usage.
- TR - the antenna is used to transmit and receive.
- TX - the antenna is used to transmit only.
- RX - the antenna is used to receive only.
- DR - the antenna is used to receive only in a space diversity configuration.
- TH - the antenna is used to transmit and receive in a hybrid diversity configuration.
These antenna types are combined into antenna configurations, as shown in the following table:
|
Two Way Antenna Configurations |
|
|
TR-TR |
A single antenna is used at each site to transmit and receive. |
|
TRDR-TRDR |
Two antennas are used at each site in a space diversity configuration. The TR antenna is used to transmit and receive. The DR antenna is the diversity receive only antenna. |
|
TXRX-TXRX |
Two antennas are used at each site to transmit (TX) and receive (RX). |
|
TXRXDR-TXRXDR |
Three antennas are used at each site to transmit (TX), receive (RX) and space diversity receive (DR). |
|
TR-TRTH TRTH-TR |
This is a hybrid diversity configuration which uses frequency diversity in both directions and space diversity at one end of the path only. At the space diversity end, the TR antenna and TH antenna each transmit and receive one pair of the frequencies. The two configurations determine which site is equipped with space diversity. |
|
TR-TXRX |
A single antenna is used at Site 1 to transmit and receive. Separate antennas are used at site 2 to transmit and receive. |
|
TXRX-TR |
This is the reverse configuration of the above TR-TXRX configuration. |
|
One Way Antenna Configurations |
|
|
TX-RX RX-TX |
Transmit at one site and receive at the other. The two configurations identify the transmit and receive sites. |
|
TX-RXDR RXDR-TX |
Transmit at one site and diversity receive at the other. The two configurations identify the transmit and receive sites. |
In any of the link design modules, select the Configure - Antenna Configuration menu item to set the antenna configuration. If the antenna configuration is displayed on the status bar, you can also click the left mouse button on the configuration box.
Antenna Combinations
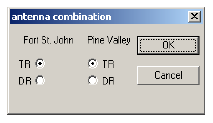
Diversity and separate transmit and receive antenna configurations have several antenna combinations. Each combination must be analysed separately. Click the antenna combination field in the status bar to select a new combination. An antenna must be selected at each site to define the combination.
Profile Displays
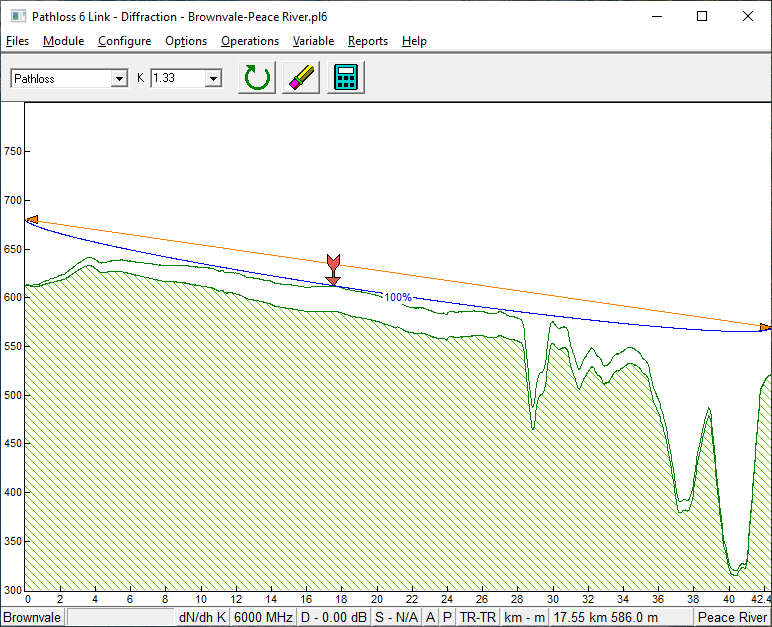
Profile displays are used in the link design modules of the program. The basic operation of these displays is described below using the Diffraction Module display as an example.
The profile display in the Terrain Data module is an exact representation of the users data. In all other displays, the terrain profile is preconditioned so that the minimum distance between profile points is one percent of the path length. Points are inserted to meet this requirement using linear interpolation. This is a necessary step to display the effective earth radius. Most displays show the flat earth profile with a diagonal fill pattern and a second profile above this to represent the effective earth radius. The corresponding earth radius factor (K) will either be displayed on the status bar or as a selection in a drop down list on the control bar.
Status Bar
The status bar includes short cut operations to commonly used functions. The selections depend on the link design module.Click on each box in the status bar to determine if additional functionality has been implemented. The following selections are implemented on all profile displays:

Site Name
Click on either site name at the ends of the status bar to access the Site Data entry form. This form includes all available site parameters. Note that if the GIS settings for the site do not use a geographic projection, then the form will display both the latitude-longitude and the easting - northing - zone projected coordinates.
Measurement system

Click on the measurement units box on the status bar to convert between metric and miles-feet.
Profile Cursor
Profile displays use a cursor for various operations. The cursor is positioned on the display using the cursor keys or by clicking the left mouse button on the display. The cursor location is shown on the status bar. The cursor style and movement are described below:
Cursor Style
The default cursor style is a red arrow. Press the letter ‘A’ to change between an arrow and lines to the antenna. The latter is useful in assessing the clearance from some point to the antennas. The cursor style is also shown on the status bar as ‘A’ or ‘L’. Alternately, click on this letter to change the cursor style.
Cursor Movement
Three cursor movement methods are used in the profile display:
- P (profile) the cursor can be positioned on any point of the terrain profile.
- S (snap) the cursor can only be positioned on peaks of the profile.
- C (continuous) the cursor can be positioned anywhere on the display. This option is only used in the Diffraction module.
The letters P, S or C appear on the status bar. To change the cursor movement, press the letter for that movement or click the left mouse button on the letter in the status bar.
Terrain Data Point Information
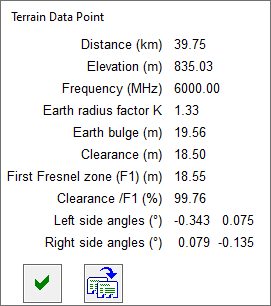
Click on the cursor location box on the status bar for information on the point at the cursor location. The format will vary depending on the link design module. Alternately, press the Ins key.
Selecting a Segment of the Profile
Many calculations involve selecting a segment of the terrain profile. Several examples are:
- Defining the end points of a reflective plane.
- Terrain roughness calculations.
- Inhibiting reflections over a portion of the profile.
- Manual diffraction loss calculations.
The basic procedure, in all cases, is as follows:
- Place the cursor at one end of the segment and press the F1 key or click the right mouse button. The cursor will change color to indicate that it has been selected.
- To cancel the first point selection, press the F8 key or click the reset button
 on the display.
 - Move the cursor to the opposite end of the segment and press the F1 key again or click the right mouse button.
Fresnel Zone Reference
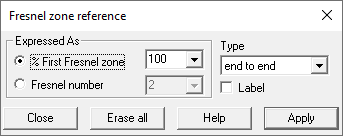 Fresnel zone references are an essential part of any terrain profile analysis. In profile displays, the Fresnel zone dialog is accessed from the menu bar or with the F2 key.
The Fresnel zone reference can be expressed as a percentage of the first Fresnel zone reference or as a Fresnel number (e.g. F2 = 1.414 F1).
Several types of Fresnel zone references are available. On line of sight paths, the Fresnel zone references are always drawn from end to end. On obstructed paths, a more meaningful representation is achieved by drawing the Fresnel zones between the horizons.
If a reflective plane has been defined, the Fresnel zones can be drawn to the reflection point. This provides a visual representation of the area along the profile required to support a specular reflection.
If the label box is checked, the value (100% or F2) will be written at the mid point.
There is no limit to the number of Fresnel zone references. The Fresnel zone reference settings are common to all link design modules.
Reports
Pathloss reports use the TE EDIT CONTROL, a full featured word processor, licensed from Sub Systems, Inc. The program generates the basic reports in an RTF format and then invokes the word processor. If the files are saved in RTF format, then these can be used with Microsoft Word or any other word processor that supports the RTF file format.
Each link design module includes a report menu item for the specific reports applicable to that section. Details of these reports can be found in the documentation for that link design module. Composite report generation is available in any of the link design modules and in the network display. Composite reports can be generated for multiple pl6 or plz files in the network display.
Report templates are used to format each report type. These RTF which contain all of the format settings including the page size, margins and orientation and custom headers and footers. These can contain a logo, page numbers and special fields such as the file name, company and project names.
 Report Generation in the Link Design Modules
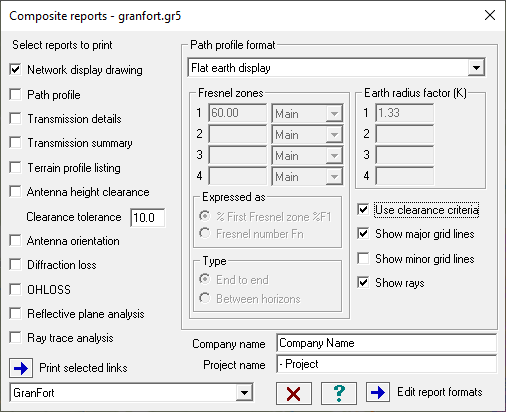
Select the Design - Reports menu item on the menu bar to access the Reports dialog. A single report or a composite report can be printed for the selected link.
Note the Blue arrow buttons on the left side of the display on the report type lines. To print any particular report, click the Blue arrow button corresponding to that report.
To print a composite report, check the desired reports and then click the Print selected reports button.
Click the Edit report formats button to set the page margins and header footer format in the report templates.
A composite report for multiple pl6 (or plz) files can be printed. First check the desired reports and then click the Multi select files to print button. An Windows file open dialog is used to multi select the pl6 files to print. This can also be carried out in the network display using a selection or group of links.
Company Name - Project Name
These fields will be inserted into the header and footer as specified by the COMPANYNAME and PROJECTNAME keywords in the report templates.
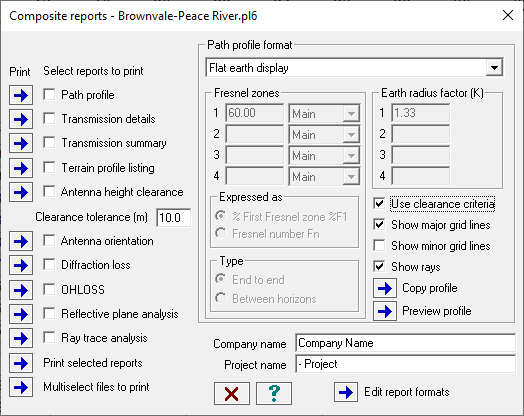
Path Profile Format
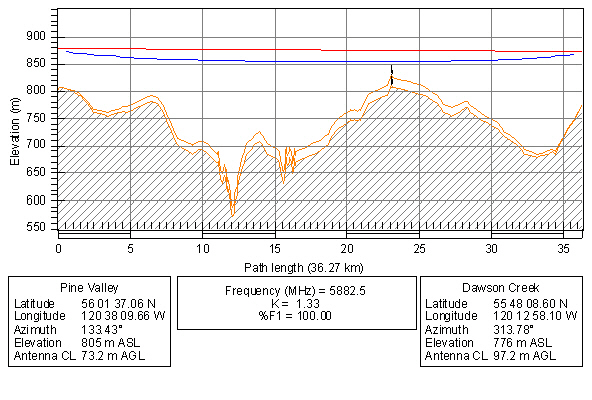
A path profile drawing is included in the Transmission summary report and is available as a single page landscape report. Note that the Use clearance criteria check box is only visible when the Path profile format is set to a flat earth display. When the Use clearance criteria is checked, the clearance criteria for the current link is displayed and all Fresnel zone and Earth radius factor options are inhibited.
The profile format can be a flat earth display, a curved earth display with straight axis or a curved earth display, with curved axis.
Four values of K can be shown using the flat earth display or a single value with the curved earth display.
Four Fresnel zones can be drawn between the main antennas or between the main to diversity antennas. On obstructed paths the Fresnel zones can be drawn end to end or between the horizons.
Click the Preview profile button to display the results. Click the Copy profile button to copy the profile drawing to the clipboard for use in another application. To change the axis or label fonts, line widths and colors select the Configure - Options - Program options - Profile Display menu item.
Report Generation in the Network Display
Select the Operations - Link Reports to access the Reports dialog in the network display. This is used for printing reports for multiple pl6 files. Note the following differences between this dialog and the link design reports dialog.
- The network display can be included in the report
- The Preview profile and Copy profile buttons are not available
- Individual report printing is not available
- If the Use clearance criteria is checked, the current default clearance settings will be displayed; however, the reports will use the actual clearance criteria in the pl6 files
Select the files to print (selection, group or all links from the drop down list) and click the Print selected links button.
Report Formats
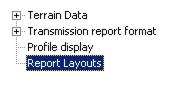
In the network display or link design module select the Configure - Options - Program options - Report layouts menu item. Alternately, in the reports dialog click the Edit report formats button.
RTF template files are provided for the following reports:
|
Transmission Summary |
P5transcalc_summ.rtf |
|
Transmission Detail |
P5transcalc_detl.rtf |
|
Profile Display |
P5profile_disp.rtf |
|
Default Report |
P5default_rept.rtf |
|
Composite Reports |
P5batch_print.rtf |
|
Interference Case Detail |
P5interf_casedetl.rtf |
|
Interference Cross Reference |
P5interf_crossref.rtf |
|
Performance Summary |
P5perform_summ.rtf |
|
Network Display - Portrait |
P5network_port.rtf |
|
Network Display - Landscape |
P5network_ldsc.rtf |
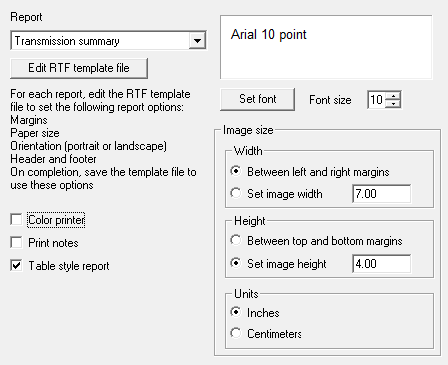 These files are located in the users AppData\roaming\Pathloss6\cstmdata folder. The template files contain the report formatting including the header and footers. For each report click the Edit RTF template file button and edit the format as stated in the text in the template files.
The network display printing is automatically set to portrait or landscape based on the drawing aspect ratio.
Select the specific report to edit its format. The following formatting options are available:
- Units -set the units to either inches or Centimeters.
- Image size - this is the size of the image (usually a profile display) as it will appear in the report. This can be resized in the report itself; however, in batch printing, the appropriate size should be determined on a single report before carrying out a batch print.
- Set font - a different font can be used for each report type
- Color printer - a reflection analysis report uses color coded lines to display the relative receive signal level as a function of a variable. If color printer is not checked the coding will be changed from colors to a dotted or dashed line style.
- Print notes - the contents of the pl6 file note pad can be included in the report. This option only refers to reports in the link design module.
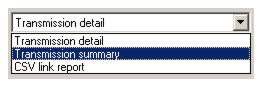
Transmission Report Options
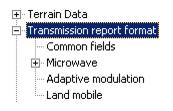
The specific fields used in transmission reports can be are completely configurable. Separate settings are available for:
- Transmission summary report
- Transmission detail report
- CSV link reports
 Each setting consists of the common fields and the specific calculation method.
Select Configure-Options-Program Options-Transmission Report Format-Common Fields. Select the report to be configured from the drop down list. Check the fields to be used in the report. When this is complete, select the application (microwave, adaptive modulation or land mobile). Verify that the drop-down list is set to the correct report and check the required fields for that application.
Pathloss File Types
The following table itemizes the file suffixes unique to all versions of Pathloss program. When multiple versions are shown for a particular file type this means that those versions can open that particular file type.
|
Suffix |
Version |
Description |
|
pl3 |
3-4-5 |
These are the link design files. Each file contains the information for a single radio link including the site data at each end of the link, the path profile, the radio, antenna and transmission line specifications, frequency, polarization and the calculation methods and options. |
|
pl4 |
4-5-6 |
|
|
pl5 |
5 or 5.1-6 |
|
|
pl6 |
6 |
|
|
plz |
6 |
Pathloss 6 multiband or passive links files. |
|
gr4 |
4-5-6 |
These are the network display files which show the sites and links geographically. They include the site, link and base station data, and the file names of the associated link design files. |
|
gr5 |
5-6 |
|
|
p5g |
5-6 |
These file contains the geographic settings for the network display and include the digital elevation and clutter definitions, backdrop imagery and vector file information. The p5g file name is saved in the gr5 file. |
| p6g | 6 |
These file contains the geographic settings for the network display and include the digital elevation and clutter definitions, backdrop imagery and vector file information. The p6g file name is saved in the gr5 file. |
|
lsy |
5-6 |
Local study data file. This file contains the calculated loss for each cell in the local study array of a base station. The file has the same name as the base station. |
|
asy |
5-6 |
Area study data file. A file for each base station involved in the area study is created which contains the calculated loss in each cell. The files have the same name as the base station. The composite results for all base stations are in a separate file using the gr5 file name. |
|
ld5 |
5-6 |
Link design rules file. This file contains the design methodology, calculation options and all equipment parameters. |
| ld6 | 6 |
Link design rules file. This file contains the design methodology, calculation options and all equipment parameters. |
|
tc5 |
5-6 |
Version 5 frequency plan file. |
|
txc |
4 |
Version 4 frequency plan file. Cannot be used in version 5. |
|
ifr |
5-6 |
Interference calculation results file. |
|
id5 |
5-6 |
Text import definition file. |
|
Antenna Data Files and Lookup tables |
||
|
mas |
4-5-6 |
Binary antenna data files for microwave applications |
|
vas |
4-5-6 |
Binary antenna data files for VHF-UHF applications. |
|
asd |
5-6 |
Binary antenna data file for all applications. |
|
adf/dat |
4-5-6 |
These are common suffixes used for ASCII antenna data files in the NSMA WG16 and the TIA 840-A format. |
|
mat |
4-5-6 |
Lookup table for microwave antennas. |
|
vat |
4-5-6 |
Lookup table for VHF-UHF antennas. |
|
ant |
5-6 |
Lookup table for all antennas. |
|
ndx |
5-6 |
The antenna, radio, and transmission indexes (pl50_ant.ndx, pl50_rad.ndx and pl50_txl.ndx) are located in the users AppData\roaming\Pathloss6\equipmnt directory. |
|
Radio Data Files and Lookup Tables |
||
|
mrs |
4-5-6 |
Binary radio data file for microwave applications |
|
rsd |
5-6 |
Binary radio data file for all applications including adaptive modulation |
|
raf |
4-5-6 |
ASCII radio data files. The same suffix is used for both version 4 and 5 formats |
|
ndx |
5-6 |
The antenna, radio, and transmission indexes (pl50_ant.ndx, pl50_rad.ndx and pl50_txl.ndx) are located in the users AppData\roaming\Pathloss6\equipmnt directory. |