Network Display
The network display is the geographic user interface to the Pathloss program and provides the following functionality:
- Automated point to point and point to multi-point link creation, design and editing.
- Local and are area studies.
- Network interference analysis.
- Access to the detailed Link Design modules.
- Report generation
- The extents of the display are determined by the site coordinates. Without any sites, the display is blank. The Site list is the program data entry point.
If the default GIS file contains backdrop imagery or vectors, the extents of the display will be set to the backdrop imagery or vector extents and these will be drawn on start-up.
Tiled Map Backdrop
Map tiles are downloaded and displayed automatically. Click and drag on the map to pan the display with any cursor and use the mouse wheel to zoom in and out. Map tiles are stored locally for efficiency and performance. You can enable\disable the automatic download of files by toggling Configure – GIS System – Network Display – Map Utilities – Download Automatically.
You can enable\disable the tiled map system entirely with Configure – GIS System – Network Display – Use Tiled Map Backdrop. If this option is disabled, Pathloss operates exactly as version 5, using projections and backdrops defined in the GIS Setup Dialog. At this time, the tiled map backdrop must be disabled to perform local or area studies.
Backdrop Options
There are 3 map styles that can be switched between by using the menu Configure – GIS System – Network Display – Map Style… The options are Topographic, Street Map or Satellite.
By default, Pathloss starts with backdrop tiles enabled. To change the start up option, click Configure – Options – Program Options and select the Startup and Defaults section. The option is called Use Tiled Map Backdrop.
Backdrop Utilities
The map tile files are downloaded automatically and stored locally on the system. There are a few utilities for managing this data.
Occasionally a tile may not automatically download. In this case, right click on the missing tile and select Refresh Map Tile to re-download and display that tile.
There is a utility for deleting the cached map tiles.Click Configure – GIS System – Network Display – Map Utilities – Map Operations. Use the drop-down list to select whether to download files automatically or delete the locally cached tile.
Automatic Terrain Management
Pathloss offers DEM models and Clutter models for the world. See more about Terrain Data Sources.
Usage
Use the menus Configure – GIS System – Terrain Data… or Clutter Data… to select which models of terrain and clutter data to use.
Zoom the display to the area you wish to download and click Configure – GIS System – Download Terrain Data or click the associated toolbar button. The download dialog is pre-set with the coordinates of the screen and the formats corresponding to the terrain and clutter model in use. Click the Download button to begin the download.
Once the download is finished, the terrain data is ready to use for that area.
This process can be repeated for any area. The downloaded files are saved locally for performance and will be used automatically throughout Pathloss while using that model. You can switch between models at any time depending on the need or location of the network.
You can set which models should be used on program start from the options menu: Configure – Options – Program Options under the Startup and Defaults topic.
Manual DEM and Clutter Setup
One or both of the terrain and clutter models can be set to Manual DEM / Clutter Setup. This allows the user to use the GIS Setup dialog to define and import GIS data (such as Lidar or local formats) in to Pathloss 6. Click Configure – GIS System – GIS Setup Dialog to open the dialog. The operation of the dialog is similar to version 5. The GIS file is saved with extension p6g. The Version 6 GIS File stores the Terrain and Clutter model selections as well as the Tiled Backdrop usage and will apply them when loaded. Version 5 p5g files can also be loaded directly from the GIS Setup dialog.
Site List
The Site List is the main data entry interface for site information in the network display. In addition to manual site data entry, site data can be imported from existing PL4/PL5 files, site text files, link text files and the master database.
 Click the Site list icon on the network display tool bar or select the View - Site list menu item. The Site list uses the standard grid control data entry form. See the Grid_Data_Entry_Form for details on this control.
The table below shows all of the fields available for a site. Note that the grid control only shows those items with an ‘X’ in the right column. To add a new item using the complete site data entry form select the Edit - Add menu item. To edit an existing entry using this format, place the cursor on the desired entry and then select the Edit - Edit menu item.
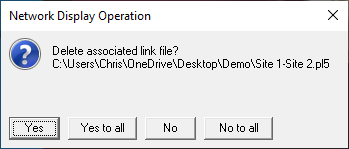
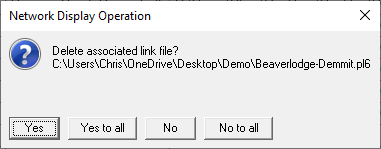
To delete a site, place the cursor on the site, hold down the Ctrl key and press the letter Y key. This sequence is referred to as Ctrl Y. Any links which connect to this site will also be deleted. If any of these links have associated PL6 files, the user will be prompted to delete these files.
To delete a selection of sites in the grid control, click on the left number column to select a site. Use the Shift and Ctrl keys to select multiple sites and then click Ctrl Y.
The minimum data entry requirements for a site are the site name and its coordinates. Two sites with the same coordinates and call sign or without call signs cannot be entered. Use different call signs if multiple sites at the same physical location are required.
| Site data field | Type | Description | |
|---|---|---|---|
| Site name | char[48] | Required entry | X |
| Latitude | double | Required entry | X |
| Longitude | double | Required entry | X |
| Call sign | char[15] | Required for multiple sites at the same location | X |
| Station code | char[15] | Optional entry | X |
| Easting | double | Projected site coordinates only | |
| Northing | double | Projected site coordinates only | |
| Zone | char | Projected site coordinates only | |
| Elevation | double | Site elevation above mean sea level | X |
| ASR | char[15] | Antenna structure registration (FCC) | |
| Tower height | double | Tower height above ground level (AGL) | X |
| Tower height w app | double | Tower height with appurtenances (AGL) | |
| Tower type | Predefined types - guyed, self supporting | X | |
| Assigned antenna height | double | See note below | |
| Address | char[47] | Optional entry | |
| City | char[47] | Optional entry | |
| State | char[23] | Optional entry | |
| Country | char[23] | Optional entry | |
| Zip code | char[15] | Optional entry | |
| Owner code | char[15] | Optional entry | |
| Operator code | char[15] | Optional entry | |
| Site type | byte | Refer to site thematic legends | X |
| Site status | byte | Refer to site thematic legends | X |
| Base station | byte | Base station defined indicator | |
| Show local study | byte | Check to include this site in an local study | X |
| Show area study | byte | Check to include this site in an area study | X |
Assigned Antenna Height
This represents the preferred height to install a new antenna on an existing tower. The value is only used in the point to point automated link design procedures. This parameter is only used in the network display and is not transferred to the individual link files (PL6).
Projected Coordinate Data Entry
If the site coordinates are set to a non-geographic projection in the GIS configuration, the complete site data entry form will be formatted for both latitude - longitude and the projected coordinates.
Either format can be entered, the other will be automatically calculated. If the site coordinates are only available in a projected format, this data entry form must be used.
Import Site Text File
Information and a step by step procedure for importing sites using a text can be found at Import Site Text File.
Import Link Text File
Information and a step by step procedure for importing links using a text can be found at Import Links From a Text File.
Base Station Text File
Convert *.ANS to PL6
Import - Export Master Database (MDB)
All procedures associated with the master database are described in a separate section Pathloss Master Database (MDB)
Import Sites from KML File
Allows the user to import sites from .kml files created in Google Earth. The sites have to be created using placemarks.
To use: From Google Earth, right click on the desired folder and click "Save Place As...". File must be saved as KML. In Pathloss go to the Site List and click Import-Import Sites from KML File.
Export Text File
Select the Export - Text file menu item on the Site list menu bar. This operation will write the site list to a delimited file.
If the site coordinates projection in the GIS configuration is not geographic, then both the latitude - longitude and the projected format will be exported.
Find Site
The Find function operates on the site name, call sign and station code columns. Set the cursor to the column and select the Find menu item on the Site list menu bar. The cursor will move to the first row that matches the letters that have been typed (an incremental search).
Mark Sites - Create Group
These two operations create a selection or group from selected items in the Site list. Click on the number column on the left side of the Site list to select a site. Use the Shift and Ctrl keys to select multiple sites. To erase the selection, click on any other column.
Select the Mark sites menu item to create a selection of the selected sites. This feature is often used to locate sites in a congested network display. If a single site has been selected, the site will be positioned in the center of the network display at the original zoom level when the Site list is closed. If multiple sites have been selected, the network display will zoom to the extents of these sites when the Site list is closed.
The combination of the Find and Mark sites features can locate a site on a large network. Set the zoom level to provide a useable display before entering the Site list.
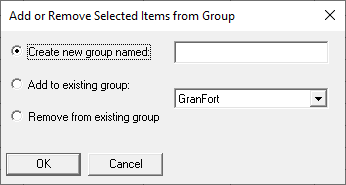
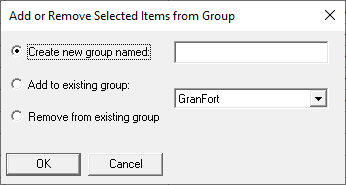
Select the Create group menu item to add the selection to an existing group or to create a new group of sites.
Update Link Files
The site data is saved in both the network file and the associated Link Files (PL6). The Update Link Files operation compares the data in the PL6 files with the site list data and reports any discrepancies found.
This provides a simple method of changing some parameter in the site data list and ensuring that all Link Files which include this site are updated.
Updating Elevations
Site elevations are stored in the site data record and in the path profile. If the update includes an elevation, both the site data and the profile will be changed to the elevation specified in the site list.
Link List
The link list contains the following fields which cannot be edited
- Names of the sites at the end of each link.
- Link type - point to point or point to multi-point.
- Associated Link File (PL6) name and folder
- In addition, the link list includes three fields used for the thematic formatting of the link lines - link type, link status and LoS (line of sight) status.
Refer to the Thematic mapping section for detail on site and link thematics.
To create a selection of links, click on the number column at the right side of the Link list. Use the Shift and Ctrl keys to select multiple links. To erase the selection, click on any other column.
To delete a single link, place the cursor on the link and click Ctrl Y. If the link has an associated link file, the user will be prompted to delete this file.
To delete a number of links, first select the links and then click Ctrl Y.
Mark Links - Create Group
These two operations create a selection or group from the selected links in the Link list.
Select the Mark links menu item to retain the current selection in the network display.
Select the Create group menu item to add the selection to an existing group or to create a new group of links.
Design Module
To access a Design Module for a particular link, place the cursor on the link line and select Module from the menu. Then select the specific Link Design Module.
Navigating the Network Display
The first five buttons on the tool bar set the cursor mode which controls the network display
 Pan Cursor
Press the left mouse button and move the mouse to pan the network display. If the Ctrl key is down, then the operation changes to zoom as described below:
 Zoom Cursor
Click the left or right mouse button to zoom or shrink the network display by 10%. The display will be centered on the mouse cursor location. Alternately, left click and drag to zoom to the focus rectangle extents. If the Ctrl key is held down, the operation changes to pan as described above.
![]() The extents button sets the zoom level to display the network extents. This is determined by the extents of the sites, backdrop imagery, vector data, local and area studies or a user defined area. Any combination of these can be used to set the overall drawing extents. Refer to the Extents - Layers paragraph in this section for further details.
The extents button sets the zoom level to display the network extents. This is determined by the extents of the sites, backdrop imagery, vector data, local and area studies or a user defined area. Any combination of these can be used to set the overall drawing extents. Refer to the Extents - Layers paragraph in this section for further details.
Link Cursors
![]() Link cursors are used to create links between sites and to access the Link Design modules. Separate cursors are provided for point to point and point to multipoint links. These cursors are shown as an arrow with sites attached to it - two sites for point to point and three sites for point to multipoint.
Link cursors are used to create links between sites and to access the Link Design modules. Separate cursors are provided for point to point and point to multipoint links. These cursors are shown as an arrow with sites attached to it - two sites for point to point and three sites for point to multipoint.
To create a link between two sites, left click on the first site legend and drag the mouse to the second site legend. The PTP cursor is used to create point to point links. The PTMP cursor is used to create point to multipoint links with the restriction that the first site must be a base station.
In the link cursor mode, an alternate method of panning and zooming is available. Hold down the shift key to temporarily switch to the pan cursor. Hold down the Ctrl key to temporarily switch to the zoom cursor.
In the link cursor mode, a left click on a site legend is used only to create new links by a click and drag operation.
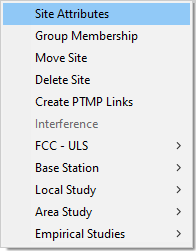
Right click on a site legend to access the site operations menu. These are described in Operations section.
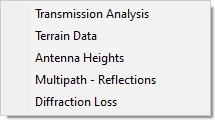
Left click on a link to access its Link Design modules. Note that only the Transmission Analysis and Terrain Data selections will be active if the design does not exist, or a terrain profile is not available.
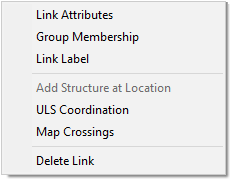
Right click on a link to access the link operations menu.
Selection Cursor
![]() Network operations can be carried out on groups of sites and links. These groups are saved in the gr5 file. A selection is a temporary group and only one selection can exist at a time. The selection cursor uses the standard windows arrow cursor. The operation is described below:
Network operations can be carried out on groups of sites and links. These groups are saved in the gr5 file. A selection is a temporary group and only one selection can exist at a time. The selection cursor uses the standard windows arrow cursor. The operation is described below:
- Left click on a site or link to select it. Operationally a link selection can exist without the end sites. This is the case in the Design links function. From a network visibility viewpoint, if a link is visible, then the end sites will always be displayed.
- Hold down the Ctrl key and left click on a site or link to add it to the selection or remove it from an existing selection.
- Click and drag to select the sites and links inside the selection rectangle.
- Hold down the Ctrl key and click and drag to add the sites and links to the current selection.
- To clear a selection, click anywhere on the network display other than on a site or link. If the cursor mode is changed back to the PTP or PTMP cursor, then the selection will persist. In order to clear the selection, the cursor mode must be temporarily reset back to the selection mode.
Note that many network display operations such as clicking on a link to access the Link Design modules menu are inhibited in the selection cursor mode.
On Screen Measurements
![]() Click the Measure button to enter the measurement mode as indicated by the cursor.
Click the Measure button to enter the measurement mode as indicated by the cursor.
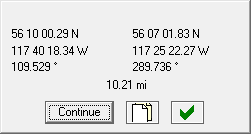
Click and drag to measure the distance and azimuth between two points. The results can be copied. Click the Continue button to make another measurement or click the green check mark to end the measurement session and return to the previous cursor mode.
On Screen Profile Generation
![]() Click the generate profile button. A profile preview window will appear. Position and size this window as required. Click and drag between the end points to generate the profile. Note that clutter is not used on the profile preview. On completion, the profile is regenerated to include the clutter and is presented in the Antenna Heights module. The user can proceed to establish the feasibility of the path and complete the design.
Click the generate profile button. A profile preview window will appear. Position and size this window as required. Click and drag between the end points to generate the profile. Note that clutter is not used on the profile preview. On completion, the profile is regenerated to include the clutter and is presented in the Antenna Heights module. The user can proceed to establish the feasibility of the path and complete the design.
If the profile starts on an existing site (the mouse cursor is inside a site legend when the click and drag is initiated) then the coordinates of that site will be used. Similarly, if the mouse cursor is inside a site legend when the left mouse button is released, then the coordinates of the end site will be used. Otherwise, the coordinates will be determined from the screen pixel location. Depending on the zoom level, screen resolution, and the nature of the backdrop (geo-referenced or edge referenced) inaccuracies may result.
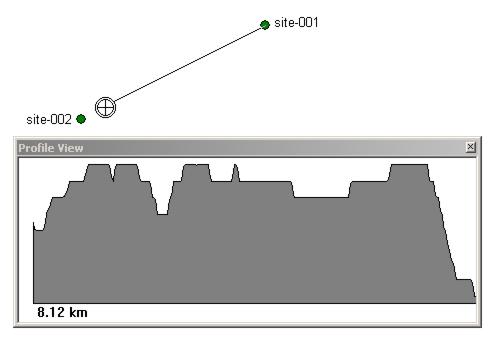
In the display above, the profile is being generated from site-001 to site-002. The Profile View screen show the progress of the profile generation. Click the right mouse button at any time to cancel the operation.
Elevation and Clutter Backdrops
![]() Elevation and clutter backdrops are created for the current network display zoom level. The coordinates of each pixel on the network display are determined and the elevation or clutter value is read from the database. A bit map is created and displayed. If the display is subsequently zoomed, the bitmap is not regenerated but simply zoomed to the new scale. These backdrops are therefore very dynamic. As the network display view is changed to different areas, the user will regenerate the backdrop.
Elevation and clutter backdrops are created for the current network display zoom level. The coordinates of each pixel on the network display are determined and the elevation or clutter value is read from the database. A bit map is created and displayed. If the display is subsequently zoomed, the bitmap is not regenerated but simply zoomed to the new scale. These backdrops are therefore very dynamic. As the network display view is changed to different areas, the user will regenerate the backdrop.
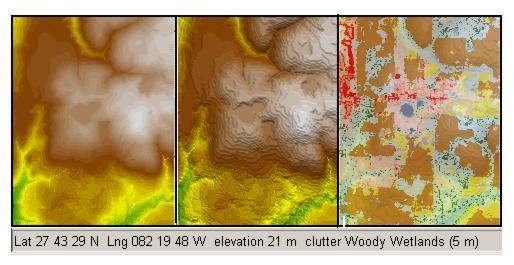
Colors for the elevation backdrops are set in the Elevation color ramp described below. Clutter colors are set in the Clutter definition table in the GIS configuration. The effects of the three buttons are shown above. The first button - Elevation backdrop simply color codes the display. The second button - Shaded elevation backdrop adds shading to produce a contouring effect. The third button - Clutter backdrop colors the display according to the clutter colors.
When an elevation or clutter backdrop is active the status bar shows the elevation and clutter type.
 The E and C button on the tool bar toggle the elevation and clutter backdrops on and off.
Elevation Color Ramp
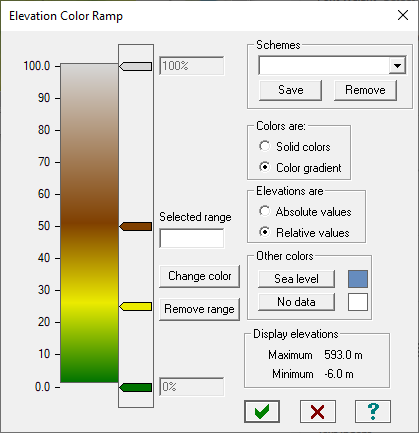
Select the Backdrops - Elevation Color Ramp menu item. The standard color ramp is used. Details of this control are given in the General program operation section. The following additional options are provided for the elevation backdrop colors:
- The elevations can be represented as solid colors or a color gradient. The solid color option can be used to show contours.
- Elevations can be displayed as relative or absolute values. If absolute values are used, the maximum and minimum values must be entered. The values for the current display extents are shown.
- Click the Sea level button to set the color for sea level (0 elevation values).
- A special color is used to show elevations which are marked as no data values in the elevation database. Click the No data button to set this color.
Note that all colors in the elevation display have transparency settings. These can be used to produce special effects. For example, a display could be created which only shows elevations within a certain range. The colors in the visible area would be set to opaque and the colors in the other range would be set to transparent.
Define Link Legend
Pathloss 6 can quickly color code and label existing network links according to several criteria.
Note: if a link has no file associated with it, or the file cannot be opened, the link will not be assigned a legend. If the file can be opened but the criteria value has not been entered or calculated, the No Data color will be applied. Otherwise, the link will be colored according to the display criteria color ramp.
Click Operations - Define Link Legend or press (Ctrl-B) from the Network Window to access the Link Legend Dialog.
Link Legend Dialog
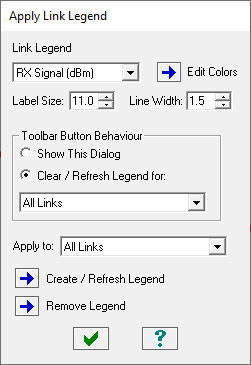
The link legend dialog is used for 3 purposes:
Set the Display Criteria, colors, line width and label size:
The section at the top allows you to change the display criteria, line width and label size. Changes will be reflected immediately on the screen. The mouse-wheel can be used while the cursor is on the window to quickly change values. The Legend Label will be hidden if the size is reduced to the minimum.
Click the Edit Colors button to edit the color ramp and the no-data color used for the selected criteria. Each criteria has it's own set of colors.
Set Link Legend Toolbar button behavior:

The default option for the toolbar button is to open the Link Legend Dialog. It can also be set to automatically clear and refresh the legend for all links or for any group without showing the dialog box. This setting is saved with the Network .gr6 file.
Apply or Remove Link Legend:
The two blue arrow buttons at the bottom will apply and remove the legend to the selected group (Or All Links)
Pressing Esc will close the Dialog. Pressing Enter will Apply the link legend to the selected group and close the Dialog.
Show Legend Data
While the legend is on screen, you can Left click on a link (with the PTP or PTMP link tool) and select the menu item Show Legend Data to see all of the legend data for that link.
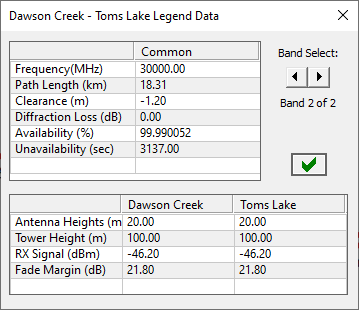
You can use the arrow buttons or left and right keyboard keys to switch between bands. Click the green check, or press Enter or Esc to close this dialog.
Accessing the Link Design Modules
Links can be created in the network display by any of the following methods:
- Left click on a site legend and dragging to the next site.
- Importing Pathloss data files in the Site list.
- Importing a link text file in the Site list.
- Importing a link from the MDB in the Site list.
- Automatic link generation using the Create PTP links and the Create PTMP links operations.
Once a link is created, the Link Design modules are accessed by a left click on the link with the link cursor. Select the menu item for the Link Design module as required. Note that the Antenna heights, Multipath - Reflections and Diffraction loss menu items are inhibited if this is a new link or a path profile does not exist in the PL6 file associated with the link.
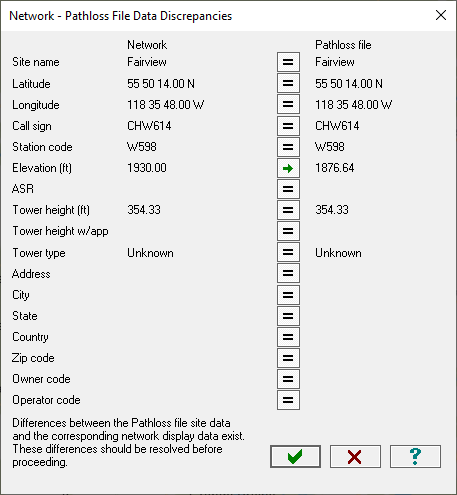
The Network File (GR5 or GR6) contains the site data record for each site in the network display. The Link File (PL6) contains the same site data record for the sites at each end of the link. If any discrepancies exist between the network display site record and the corresponding record in the Link File, the user will be notified.
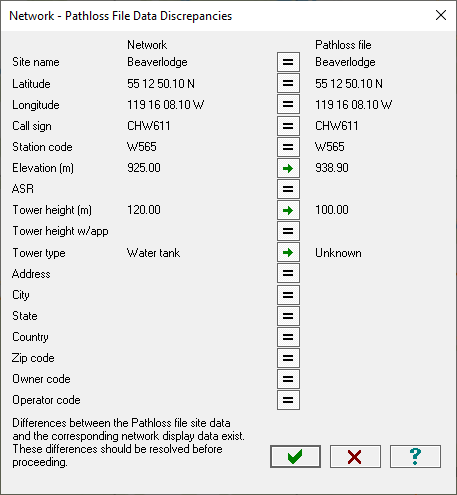
The Network - Pathloss File Data Discrepancies dialog lists the site data record for both the network display and Pathloss data file. If two items are equal, an equal sign is shown between the two data items; otherwise, a green arrow pointing right towards the Pathloss file or a blue arrow pointing left towards the network will be shown.
These arrows indicate whether the network data or Pathloss file data is to be changed. Note that the user can click on these arrows to change their direction.
In the above example the elevations and tower types are different. With the arrows as shown, the following action will take place if the green check is clicked:
- The elevation in the Site 1 data record in the link file will be changed from 938.90 meters to 925.0 meters. The elevation at the Site 1 end of the path profile will also be changed to 925.0 meters.
- The tower type in the link file will be changed from a "Unknown" to a "Water tank".
- The tower height in the link file will be change from 100 meters to 120 meters.
Note that if the ✘ is checked, nothing will be changed.
Site Data and Profile Elevations
Elevation discrepancies can have a special significance in manual design operation. Consider the following situation.
The user has imported a site data text file which includes site elevations. Links are created in the network display and a path profile is generated in the Terrain Data module. At this point, the end point path profile elevations are the terrain database elevations. The terrain profile generation procedure does not automatically use the imported site elevation (the elevation in the site list). The user closes the Link Design module and returns to the Network Display. The discrepancy dialog will appear for each site showing the imported elevation in the network display and the terrain database elevation in the Pathloss file. The user is faced with the decision to overwrite the imported elevations with the terrain database elevations or to modify the end point of the terrain profile with the imported elevations. The following points need to be considered to decide which is the best approach.
Calculations such as antenna heights, clearance and diffraction loss are based on the clearance to first Fresnel zone ratio. In these calculations, all elevations are relative to the end point elevations. The absolute elevations above mean sea level are not used. In other words, shifting the entire profile up or down will have no effect on the antenna heights.
Therefore, the absolute error in the elevations has no significance in the calculations. It is the relative errors (the elevation differences between the end points and the critical points on the profile) which make the difference. Changing the site elevations has the same effect as changing the antenna heights.
The type of terrain database must be considered. These can be divided into two classifications for the purposes of this discussion - bare earth and composite terrain and clutter. NED data is an example of the first and SRTM is an example of the second type. In the case of the composite terrain and clutter database, the elevations may include some degree of structure heights and the site ground elevations should be used in the profile. In all other cases, the accuracy of the site elevations and the resolution of the terrain database will determine the choice.
Extents - Layers
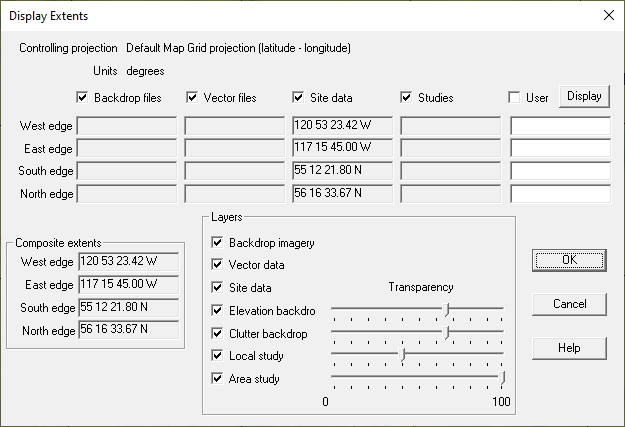
Select the View - Extents-Layers menu item. The composite extent of the display is the maximum of the following components:
- Backdrop imagery
- Vector files
- Site data
- Local and area studies
- A user defined area
The units of the extents are those of the current network display projection.
 Any of these components can be excluded from the composite extents by unchecking the item. When the Scale to Drawing Extents button is clicked, the display will be zoomed to these composite extents
The user can specify the extents of the network display. Check the User item and enter the values for the east, west, north, and south edges. It may be necessary to uncheck the other contributors to the extents if these are larger than the desired extents. Note that this feature can be used on a new project which does not have site data, imagery, or vector data to define the extents. Once the extents have been established, the elevation and clutter backdrops can be used. Click the Display button to set the extents to the current network display zoom level.
The default network display uses a Transverse Mercator projection with a central meridian located at the center of the extents. This projection has a valid east - west range of about 6 degrees. Outside this range, distortion will increase to unacceptable levels. In some countries, a network can extend well beyond this valid range. If an elevation backdrop is attempted, the distortion at the east and west edges will be obvious.
In these cases, the User extents can be used to limit the projection. First zoom the display to an area within the 6 degree east west limit. In the Display extents dialog, click the Display button to set the display extents. Check the User item and uncheck all other items.
The following additional functions are available in the Display Extents dialog.
- Shows the network display projection.
- Allows the user to selectively toggle the visibility of any of the network components. The toolbar buttons labelled B, E, C and V, perform the same functions for the Tiled Maps (M) Elevation Backdrop (E), Clutter Backdrops (C) and Vector data (V), respectively.
- Sets the overall transparency of the elevation and clutter backdrops and the local and area studies. Note that the transparencies of the individual colors can be set for elevation, local and area studies using the color ramp control. The transparency cannot be set for the individual clutter colors.
Network Display Options
Attributes
Select the Configure - Options - Network display options menu item. This selection sets the default options for the site name, legend, link line styles and link labels. All new sites and links will use these settings. Individual settings can be modified in the network display as follows:
- Site name and legend - Right click on the site legend and select the Site attributes menu item.
- Link lines - Right click on a link and select the Link attributes menu item.
- Link labels - Right click on a link and select the Link labels menu item.
- The attributes of a group or selection of sites / links can be reset to the default options. The group or selection must be made before entry to the options. Each attribute option includes a Reset operations apply to drop-down list. which contains all groups and any available selection.
 Site Name - Legend
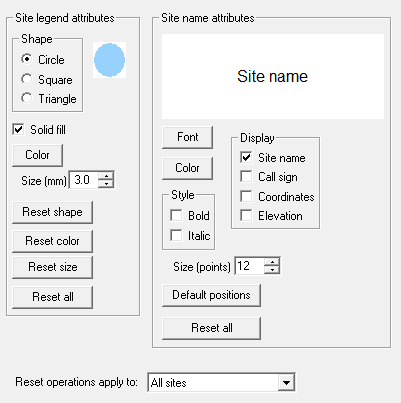
The following default attributes can be set for the site legend:
- Color
- Shape (circle, square or triangle)
- Solid fill or outline
- Size expressed in millimeters
Existing sites in the network display can be reset to any or all of these attributes. These attributes will be assigned to all new sites.
The following default attributes can be set for the site name label.
- Base font, font style (bold or italic), color and point size.
- The name label can include the site name, call sign, coordinates, and the elevation.
- Site names can be positioned in the network display using a click and drag operation. A line is drawn to the site legend to indicate which site the name applies to. The Default positions button sets the site name label position relative to the site legend to the initial default location.
To set the attributes of a particular site, right click on the site legend or site name.
On dense networks the display can be more readable when the site name label is switched off. To view the name or turn the label back on, right click on the site legend.
 Link Lines
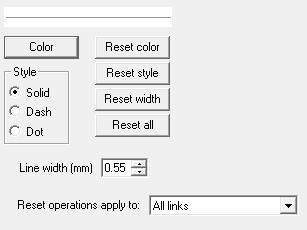
Select the Configure - Options - Network display options - Attributes - Link lines menu item. The following default attributes can be set for link lines:
- Color
- Line style (solid, dash or dot)
- Line width
Existing links in the network display can be reset to any or all of these attributes. These attributes will be assigned to all new links.
To set the attributes of a particular link, right click on the link and select the Link attributes menu item. The same attributes are available as in the default link attributes above.
 Thematic and Site Legend and Link Line Colors
The color settings for the site legend and link lines described above, can be overridden using the thematic simply by assigning a color to a site and link status. The procedure for the site legend color is given below:
In the Site list, select the Thematic mapping - Site status menu item. Enter some descriptive term for the Status field and double click on the Color field and set the corresponding color.
In the Site list, double click on the Status field for a site and then select one of the status descriptions from the drop-down list. The Site type field must be left as “not defined”. When the Site list is closed, the sites will be colored according to their status. The same procedure can be used for link lines. A complete discussion of the thematic mapping features is given in a following section.
Link Labels
Select the Configure - Options - Network Display Options - Attributes - Link Labels menu item.
Label Format
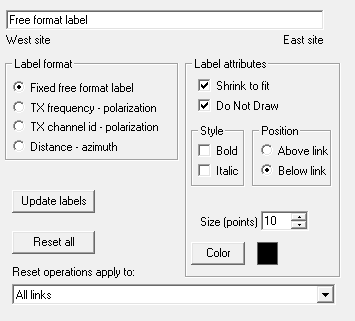 A label can either have a fixed free format or can be one of the predefined formats. In the latter case, the label data will be taken from the link file associated with the link. If a file association does not exist, the label will not be drawn. The following label formats are available:
- TX frequency and polarization
- TX channel ID and polarization
- Distance and azimuth
Link labels use the site name font.
Label Attributes
Link labels use the site font. The font style (bold, italic), color and the point size can be set.
Label drawing can be suspended by checking the Do not draw option.
Labels can be drawn above or below the link line.
The Update labels button operates by reading the associated link file (PL6) for each link in the network display. The label is formatted with the new data and updated. Note that the existing Label format in the link is not changed.
The Reset all button operates by reading the associated link file (PL6) for each link in the network display. The label is formatted with the new data using the specified Label format and Label attributes.
The Shrink to fit option in the Link attributes section attempts to fit the label on the link line using the specified font Size (points) at the current zoom level. The font size will be reduced until the label fits or the label is too small to read. This operation will be carried out each time the zoom level is changed.
To set the label for a specific link, right click on the link and select the Link label menu item.
Axis - Map Grid
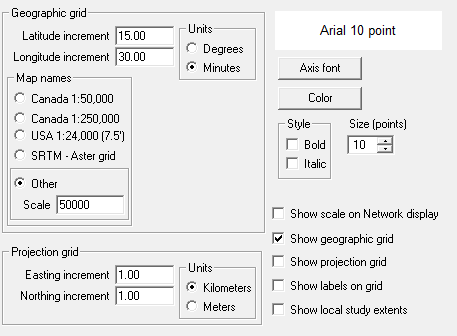
A geographic grid or rectangular projection grid can be added to the network display. The choice is determined by the current network display projection. This will be geographic under the following conditions:
- There is no backdrop imagery.
- A geographic projection is used for any vector data.
- Site coordinates are set to either a geographic or variable zone projection.
Map Crossing Reports
To generate a map crossing reports for a link, right click on the link and select the Map Crossing Report menu item. If a geographic grid is active the report will include the following additional information:
- NTS map names for the Canada 1:50,000 and Canada 1:250,000 Map names options
- Map names for the USA 1:24,000 Map names option.
- SRTM file names for the SRTM - Aster grid Map names options
Thematic Mapping
The default site and link attributes offer a limited selection of shapes and line styles to differentiate between different classes of site and links. This section deals with thematic mapping of sites and links which includes the capability of coloring the site legends and link lines according to their status.
Site Thematic Legends
True type fonts are used for the site legends in thematic mapping The Webdings and Wingdings fonts contain characters which are suitable for this purpose. There are two parts to a thematic site legend. The site type determines the symbol, and the site status determines the color. At present, 8 site types and 8 site status values are available.
If both site type and site status are undefined then the standard circle, square and triangle shapes are used. If the site type is defined and the site status is not defined, then the font can be edited using any combination of colors.
Click the “site list” tool bar button or select the View - Site list menu. The thematic site legend columns are Site type and Site status. These are both drop down lists include a “not specified - defined” item and the 8 site and status types.
Site Type
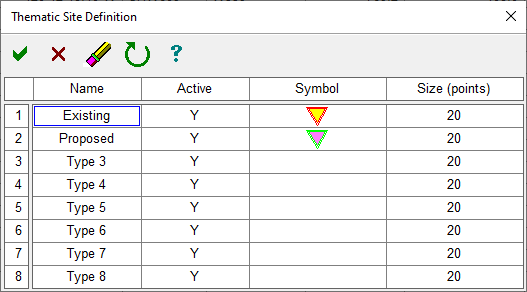
Select the Thematic mapping - Site type menu item.
Place the marker on the symbol cell for the site number being defined and click Enter or double click on the cell. Each time a symbol is defined, it will be added to a list of symbols. This list is automatically saved in the file AppData\Roaming\Pathloss6\cstmdata\thsymbol.lst.
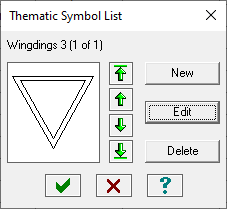
Click the New button to create a new symbol. Select the Font menu item and choose a font. Double click on a character to select it.
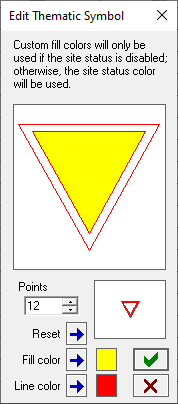
If the site status will not be used, then click the edit button and set the colors as desired.
Enter a name for the site type (the default names are “Type 1 to 8”, set the active state and the point size of the legend.
Site Status
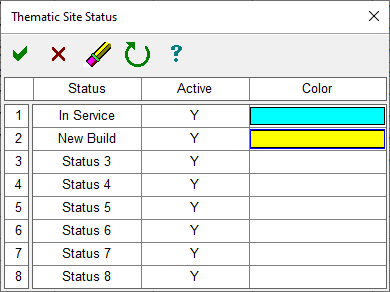
Select the Thematic mapping - Site status menu item.
Enter a name for the status, set the active state and double click on the color column to set the color.
In the site list double click on the Site type cell or Site status cell to set the particular value. The status color will now override the previously specified site color.
Thematic Links
Click the link list button on the toolbar or select the View - Link list menu item.
A thematic link line consists of three components. The link type and link status are equivalent to the site type and status described above. The link type determines the line style and the link status determines the line color. The third component is actually a second link line whose style and color represent another status variable for the link. The expected use of this second links line is to track the line-of-sight testing on large metropolitan networks. This status is designated LoS.
At present, values for 8 link types, link status and LoS status can be specified.
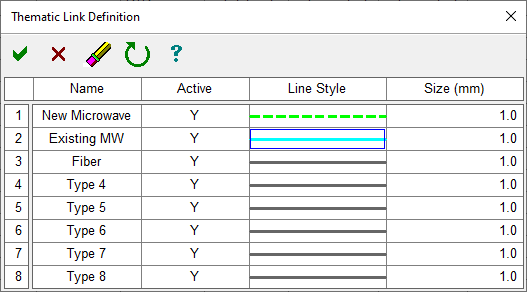
If both link type and link status are undefined then the standard solid, dash dot lines defined under link line attributes are used. If the link type is defined and the link status is not defined, then the line color set in the line type definition is used.
Note that the LoS line (second link line) is drawn first. The link status line is drawn on top of the LoS line. The line styles, widths and colors should be chosen, so that both lines are visible.
The thematic link line columns are Link type, Link status and Line of sight (LoS) status. These are both drop down lists include a “not specified - defined” item and the 8 link, status and LoS states.
Link Type
Select the Thematic mapping - Link type menu item. Enter a name for the link type (the default names are “Type 1 to 8) and set the active state.
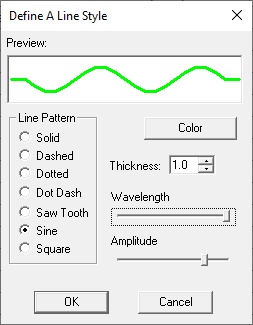
To set the line style, double click on the Line style cell. Choose one of the Windows standard line styles or create a saw tooth, square wave or sine wave line. If the link status is not defined, the line color can be specified; otherwise, the link status color will be used.
Link Status
Select the “Thematic mapping - Link status” menu
Enter a name for the status, set the active state and double click on the color column to set the color.
Line of Sight Status
Select the Thematic mapping - LoS status menu item.
Enter a name for the LoS status and set the active state.
Double click on the Line style cell. Choose one of the Windows standard line styles or create a saw tooth, square wave or sine wave line. Both the LoS status and the Link type lines are displayed.
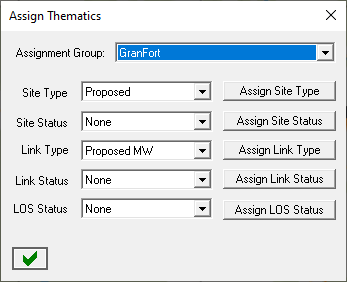
Assign Thematic
A thematic can be assigned to a group or selection in the network display. Select the Operations - Assign Thematics menu item. Select the desired group from the Assignment group drop-down list. Select the type or status for the sites and links and click the associated button.
Groups and Selections
Most operations in the network display are based on groups or a selection. These are a collection of sites, links or both sites and links. Any number of groups with unique names can be created and these are saved in the gr5 file. Groups can overlap one another i.e a site or link can be in several groups. Groups are used to control the network display visibility and are an essential feature when working with large networks.
Groups can be created in the automated link creation and design procedures and the import procedures in the Site list. This section describes the main group creating - editing operations and visibility settings.
A selection is a temporary group and is not saved in the gr5 file. Only one selection can exist at one time. A selection is always visible and can be used anywhere groups are used.
Creating a Selection
![]() Click the Selection button on the tool bar. The cursor will change to the selection cursor. In this mode, many of the normal network operations which use the point to point or point to multipoint cursor are inhibited. Create the selection as described below:
Click the Selection button on the tool bar. The cursor will change to the selection cursor. In this mode, many of the normal network operations which use the point to point or point to multipoint cursor are inhibited. Create the selection as described below:
- Click on a site or link to select it. To unselect an item, just click on it again.
- Hold the Ctrl key down and click on a site or link to add it to the selection or to remove it, if it is already selected.
- Click and drag to select a group of sites and links within the selection rectangle.
- Hold the Ctrl key down and click and drag to add a group of sites and links to the selection.
If the cursor is changed back to the point to point or point to multipoint cursor, the selection will persist. To clear a selection, the cursor must be set to the selection cursor. Then click anywhere on the network display other than on a site or link.
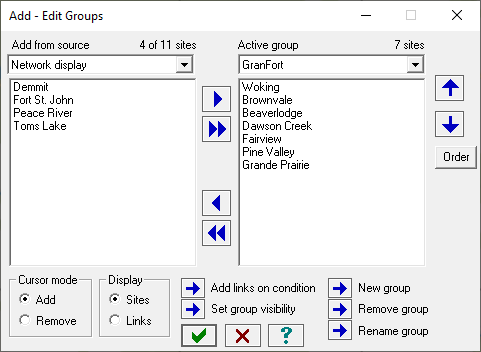
Creating and Editing Groups
Select the Configure - Groups - Add edit menu item to access the Add edit groups dialog. When this dialog is active the entire network display will be visible. Any hidden groups will be made visible for the duration of this dialog. A description of the initial state of the dialog is given below:
The display contains two lists of sites or links. The choice of sites or links is set in the Display section. The left side list contains all of the sites or links in the network display which are available to be assigned to a group. The right site list contains the sites or links in that group.
Note the header on the left side list. This shows the number of items available to be assigned to the group and the total number of items in the network display. Note that the Network display is the first item in a drop-down list. In addition, the drop-down list contains all of the existing groups. This will be described later when items in one group are moved to another group.
The header on the right site list shows the number of items (sites or links) in the selected group. The “No Groups” selection simply means that no groups have been created.
The first step will be to create a new group. Click the New group button and enter a unique name for the group. This step creates a new empty group without any site or link members, and this becomes the active group.
Adding Sites and Links to a Group
It was noted that a group can contain both sites and links. The design operations in the network display operate on either sites or links; and for this reason, sites and links are added separately. Note that this does not affect the group visibility. If a link is visible then the end sites are always displayed even it they are in a hidden group.
To illustrate the procedure, sites will be added. Check the Sites option in the Display section. Position the Add edit groups dialog so that the site(s) to be added can be seen in the network display. If necessary, zoom or pan the display. All of the network display navigation features are available in this group mode. A site can be added to a group directly in the Add - edit groups dialog or by selecting the site in the network display. The two methods are described below.
Highlight the site in the network display list on the left side and click the button shown at the right. The site will be added to the active group list and removed from the network display list. Note that this site is now highlighted in the network display.
To remove the site from the active group list, highlight the site and click the button shown at the right. The site will be removed from the active group list and placed back in the network display list. Note that the highlight has been removed from the network display.
Multiple sites can be selected for the above operations. Note that the terminology “removed from the network display” means the site is no longer available to be added to the active group list.
To transfer all items from one list to the other, use the buttons shown at the right. It is not necessary to select the items.
To add a site to the active group from the network display, first check the Add option in the Cursor mode section. Click on a site in the network display. The site will be highlighted and added to the active group list and removed from the network display list. Click and drag to add multiple sites. Links inside the drag rectangle will be ignored as the Display option is set to Sites.
To remove a site from the active group, first check the Remove option in the Cursor mode section. Click on the highlighted site in the network display. The highlight will be removed, and site will be removed from the active group list and placed back in the network display list. Click and drag to remove multiple sites. If the drag rectangle includes sites which are not in the active group list, these will be ignored.
The procedure for adding links is identical to the site procedure described above. Check the Links option in the Display section.
Moving Sites and Links from one group to another
In addition to the default Network display selection in the Add from source drop-down list, any group can be selected from this list. In this state, sites and links can be moved between the two groups in either direction using the arrow buttons.
Add links on Condition
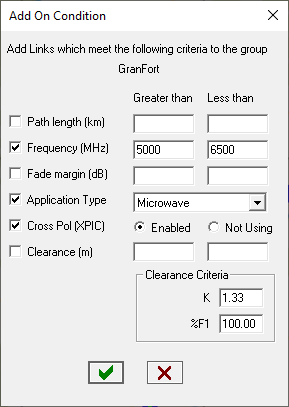
Links can be added to the Active group list based on the following conditions:
- Path length
- Frequency
- Fade margin
- Application type
- Co-channel or XPIC
- Clearance
Pathloss link files (PL6) are required for the frequency, fade margin and application type criteria. If the links do not have file associations, then these cannot be added to the group.
Click the Add links on condition button, select the criteria and enter the range of values to be used to add a link to the group. Note that it is not necessary to enter values for both the Greater than and Less than fields. For example, to create a group of links with fade margins less than 15 dB, 15 would be entered in the Less than field and the Greater than field would be left blank.
Set Group Visibility
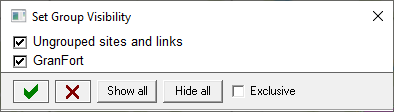
Select the Configure - Groups - Visibility menu item in the network display. In the Add - edit groups dialog, click the Set group visibility.
Check the groups to be displayed. All unchecked groups will be hidden. The first item - Ungrouped sites and links sets the visibility for sites and links which do not belong to any group.
- Because sites and links may belong to multiple groups the following rules determine if a site is visible:
- A site that is a member of any group marked as visible is always visible.
- A site that is not a member of any group is hidden if Ungrouped Sites and Links is NOT checked.
- A site that is a member of one or more groups is hidden only if all of the groups of which it is a member are not visible.
Links follow the same rules as sites for visibility with one extra rule:
- If a link is visible, the sites at either end of the link will always be visible.
Click the Display button to show the network display for the current visibility settings.
Click the Show all button to check all groups.
Click the Hide all button to uncheck all groups.
If the Set group visibility was accessed from the Add - edit groups dialog, the entire network will be displayed again when this is closed, regardless of what visibility settings were made. This is necessary for proper operation of the Add - edit groups. When the Add - edit groups dialog is closed, the visibility settings will take effect.
File Operations
This section describes the procedures under the files menu and includes the export formats, moving network files and operation with several users simultaneously accessing the network display GR5 file.
Pathloss Link File (PL6) Locking
The locking mechanism is used on link files (PL6) stored on a shared drive. When the link file is opened, a new file is created with the same name as the link file with the extension LCK instead of PL6. When the user closes this file, the lock file is erased. If another user attempts to open the file, a prompt is issued that the file is in use and will be opened in read only mode. It is not possible to save the file under another name. The program does not check if the lock file has been deleted.
It is possible to delete the LCK file outside the program to release the lock.
Import Pathloss Data File
Select the Import - Pathloss Data File menu item and multi-select the Pathloss data files to import. PL4, PL5 and PL6/PLZ file formats can be used. This import sets the site and link data for the files. The file names are associated with the links and the user can left click on a link to access the Link Design modules for that link. The display is formatted using the default site and link attributes. Refer to the Network Display Options documentation.
Multiple links between the same two sites
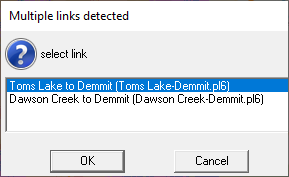
It is not possible to create multiple links between the same two sites in the network display. In many cases this is required when different frequency bands are used or when a system is being overbuilt. To create the second link, click on the existing link and select the Transmission Analysis menu item from the popup menu. Modify the existing file for the second link. This operation may use any of the Link Design modules. On completion, select the Files - Save as menu item and save the file under a different name.
Import the new file into the network display using the View - Site List - Import - Pathloss data file menu item. When the user left clicks on the link, a prompt to select the required link will be issued. Any number of files with different names can be added between the same two sites.
Re-establishing the Pathloss data file association
The full path name of the Pathloss data file is saved and the Link Design modules for the file can be accessed by clicking on the link. If the file is moved or erased outside of the program, then the file association is lost and the error message below will appear with several options
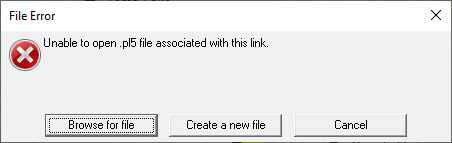
If the files actually exist in another location, then the most expedient approach will be to re-import the Pathloss data files. The program will recognize that the two end sites and the link already exist. The existing file association will be verified and if it is not valid, then the import file name will be used. In effect, only the Pathloss data file association will be changed. The site and link attributes will remain the same.
Link File Formats
Update Link files to Version 6
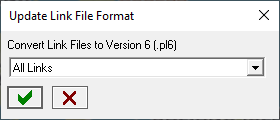
Click Files-Link File Formats-Update Link Files to Version 6. The selected file, group or all links can be saved in PL6 format. If using a selection, the selection must be made beforehand.
Export Links as Version 5
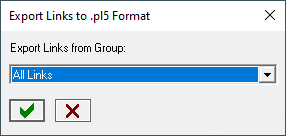
Click Files-Link File Formats-Export Links as Version 5. The selected file, group or all links can be saved in PL5 (Pathloss 5.1) format. If using a selection, the selection must be made beforehand.
Merge
Files - Merge opens a network gr5 file and add the sites, links and base stations in this file to the current network display. Any duplicate sites and links will be ignored. Studies in the file to be merged are not supported.
If the files are in widely separated regions the results will be unpredictable.
Copy - Move
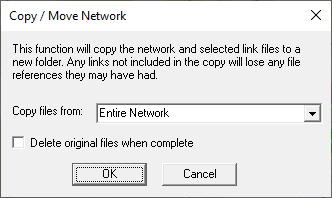
This operation copies any portion of a network gr5 file and all of its associated files to a new location. The procedure analyzes the network and the link file (PL6) associations. If any errors are encountered, the process will not be carried out. The user must correct the errors to continue. These may include:
- File not found error
- The link file (PL6) associated with a link cannot be found.
- Operation will overwrite existing files
- Pathloss data files with the same name are in different folders. These files cannot be copied to a common directory.
Select Files - Copy / Move and select the portion of the network to be copied. Click the OK button and set the directory and enter the new file name for the copied gr5 file. All attributes of the network display will be retained in the copy including:
- Site and link attributes
- All group definitions and the network visibility state
- All thematic definitions
- All local and area studies.
Open For Shared Use
The Open for shared use menu item allows a number of users to open a network gr5 file located on a shared drive. In this mode, the program will track changes made to the gr5 file and advise all users of these changes. The gr5 file cannot be saved if the revision date of the file on disk is not the same as the file in memory. This prevents changes made by another user from being overwritten.
The sharing mechanism uses a file with the same name as the network file with the extension SHR. This file will be referred to a SHR file in the following descriptions and the file contains the following information:
- The revision date and change number.
- A list of all users who have opened the network file.
- A series of records containing the changes made to the file. These records are used to update the individual users files.
The SHR file is created when the first user opens the network file. At this point the file contains the name of the user and the revision date. The change number is set to zero. The program will then begin to monitor the SHR file at 30 second intervals to determine if the revision date has changed.
The SHR file is deleted when the last user closes the network file.
Once the network file has been opened by the first user all other users opening the file will be presented with a list of users who have this file open. New users are added to the user list and receive revision date at the time that they loaded the file.
Suppose a user makes some changes to the file and saves the changes. A change is defined as follows:
- A site has been added, moved or deleted.
- A link has been added or deleted.
- The Pathloss data file name associated with the link has been changed.
When the file is saved, a record of the changes is first created by comparing the file in memory with the file on disk. The SHR file will be updated with the new revision date, and the record of changes will be appended to the file.
In this shared environment, the program checks the SHR file every 30 seconds and if a change has occurred, the user is notified with the list of changes. Each change can be viewed.
Make Changes
The changes are made directly from the SHR file. The display will not be reformatted. All of the changes in the SHR file will be made.
Reload File
The complete file will be reloaded and the display will be reformatted.
If the Cancel button is clicked, the user has the option to update the network display by reloading the file again using the Files - Open for shared use menu item.
Only one change notification is issued even if the user decides to not re-load the file. Once the file has been updated, the change notification will begin again.
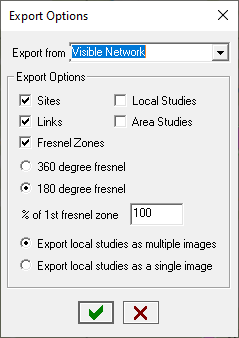
Export
The network display including all local and area studies can be exported to an ESRI Shapefile, MapInfo (MID-MIF) or to a Google Earth KMZ file. Note that there is no capability to import data from these formats.
The Export Options allow any portion of the network - selection, groups or the visible network to be exported
ESRI Shapefile
An ESRI Shapefile export consists of 3 files. Two files (SHP and SHX) describe the shapes themselves and the database file (DBF) contains additional information about the vectors. Note that local and area studies are exported in a vector format.
Select the Files - Export - ESRI Shapefile menu item and set the Export options. Click the green check and enter the export file name without an extension. This file name will be used for the three files that are created. Any extension will be ignored because shapefiles must have the expected extensions to function.
The links are stored as lines with end points in geographic coordinates referenced to the site datum. Because a shapefile can only contain one type of shape, the sites are stored as lines as well except the end points are the same and they have no length. The database file contains information about the sites only. The following data is included: site name, address, city, state, country, owner code, call sign, station code, operator code, elevation, tower height, latitude, and longitude.
MapInfo MID MIF files
The mid/mif export produces files that can be imported in to Mapinfo. Select Files - Export - Mapinfo mid mif. Select what you wish to export and click the green check mark. Next enter the file name that will be used as a prefix on all the files that are created. Two files (mid and mif) will be created for each of the following included in the export: sites, links, each local study and area study. Note that local and area studies are exported as vectors.
To import the files in to Mapinfo, select Table - Import... from the Mapinfo main menu. Select the mif file to import (the mid file should be in the same directory.) Click save in the next dialog to save the TAB file in the same directory. Repeat this procedure for each mif file you would like to import. When you are finished open a new mapper window and select the tables you would like included. Click OK to see the data displayed in a network view.
 Google Earth KMZ File
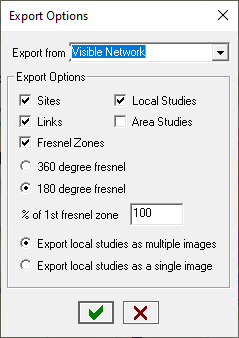
This function creates a KMZ file to display the network in Google Earth.Select the Files - Export - Google Earth and set the Export options. Local and area studies are exported using the current display criteria and range colors. The KMZ format supports per-pixel transparency as does Google Earth.
Multiple local studies can be exported as single image as used in the network display or as multiple images. There is also the option to export the link Fresnel zones to google earth as well.
![]() There is a toolbar button associated with the Google Earth export.
There is a toolbar button associated with the Google Earth export.
Suppose the display is color coded for 5 signal level ranges. In the single image option, an image file will be created for each signal range in the entire display and represents a composite signal level display. In the multiple image option, an image file will be created for each signal range for each base station. In this case, it will be necessary to switch between base stations in Google Earth to determine the contributions from each base stations in overlapping areas.
Click the ✔ and enter a file name for the KMZ file.
The studies in the KMZ use the current colors and criteria set in the color ramps for local and area studies.
To load the KMZ file in Google Earth simply select Files - Open and browse to the KMZ file. Google Earth should automatically fly to the area.
Network Operations
This section describes the functions available under the Operations menu in the network display. Separate sections are provided for the following items:
- Create PTP links
- Design Links
- Edit - modify links
Add Site
Select the Operations - Add site menu item to access the Add Site dialog. The add site cursor will appear in the center of the network display. Position the cursor to the desired location and click the Add button to create a new site at this location. If the Auto name sites option is checked, the site name will be created using the format specification show and the new site will be automatically entered into the site list and shown on the network display.
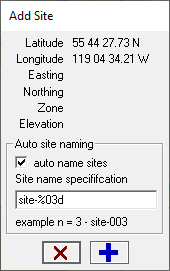
The format specifier uses the C language printf syntax. The program maintains a count of the sites added and ensures that a duplicate site name cannot be created. If the site to be added resulted in a count of 5 then the site name would be “site-005 base on the specifier “site-%03d”.
If auto site naming is not used, then an intermediate data entry form will appear with all of the available site data fields.
Note that the site coordinates are calculated from the screen pixel location. Depending on the zoom level, screen resolution, and the nature of the backdrop (geo referenced or edge referenced) inaccuracies may result.
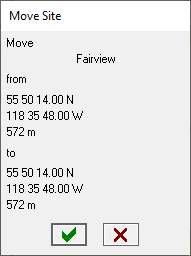
Move Site
Invoke the Move Site dialog by either of the following means:
- Right click on the site legend and select the Move site menu item.
- Select the Operations - Move site menu item and then left click on the site legend to identify the site to move.
Click on the display to position the move site cursor as required and then click the ✔ to move the site. This procedure will invalidate any path profiles associated with the new site location.
Note that the site coordinates are calculated from the screen pixel location. Depending on the zoom level, screen resolution, and the nature of the backdrop (geo-referenced or edge referenced) inaccuracies may result.
Frequency Assignments
A link file (PL6) contains the channel frequency and polarization assignments. These are set in the Transmission Analysis module on a link by link basis. The frequency assignment utility allows these assignments to be made in the network display.
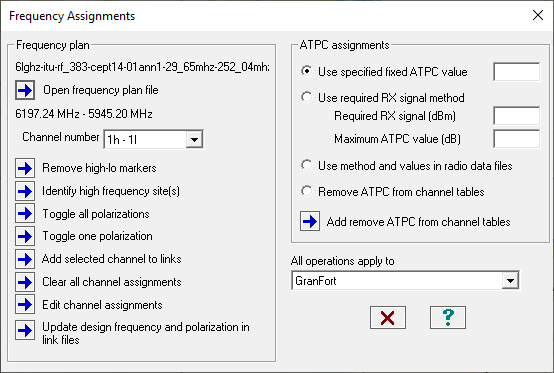
Create a selection or group of the links requiring frequency assignments. Each link must have a link file (PL6) associated with it. Select the Operations - Frequency assignments menu item. Select the required group or selection. Only the selected group or selection will be displayed.
The default frequency plan (the last used frequency plan) is initially loaded. If required, click the Open frequency plan file button and load the required file. Set the channel number to be used for the assignments.
The first step is to identify the high frequency sites. Click the Identify high frequency site(s) button. Click on the site legend of a high frequency site. All links connected to this site will be automatically set, based on the site initially designated as high. Repeat this high frequency site assignment for any unconnected links.
The Reset all high - low designations button simply resets all sites to the undefined high - low state.
Two buttons are provided for polarization assignments. The Set all polarizations to vertical button resets all links to vertical. The link polarization is shown as a label on the link lines. Click the Toggle polarization H<->V button. Then click on a link to change its polarization.
At this point, the selected channel number and polarization can be assigned to all sites. Click the Add new channel assignment button. To add additional channel assignments, select the new channel number, change the polarizations if required, and click the Add new channel assignment button again.
The Clear all channel assignments will erase the TX channel assignments in the link files (PL6) for all links.
The TX channel tables of the individual links can be directly edited in the network display. Click the Edit channel assignments button. Then click on a link to edit the channel table.
Site Coordinates Datum
Two utilities are provided to deal with datum discrepancies between the network display GIS settings and the associated pl6 files.
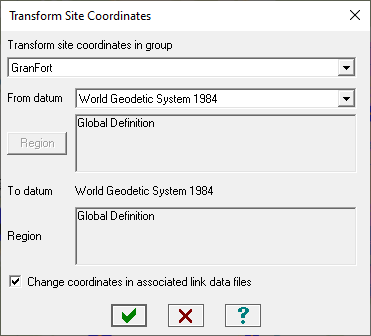
Transform Site Coordinates
Select the Operations - Transform coordinates menu item. The To datum is fixed and represents the datum specified for the site coordinates tab in the GIS setup.
Set the From datum to correspond to the site coordinates that require transformation. In most cases, the coordinates in the associated link file (PL6) will also need to be changed.
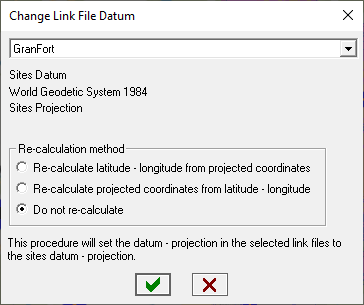
Set Link Files Datum-Projection.
This utility simply changes the datum and projection in a group or selection of pl6 files. The datum will be changed to that specified for the site coordinates tab in the GIS setup. Several recalculation methods are also provided if a projection is used.
Reports
Performance Reports
The performance report calculates the end to end performance of a group of links with PL6 file associations. There is no provision to use a default “all links” option. The group or selection must be created first. Then select the Operations - Performance report menu item.
The initial display shows the list of the available groups and the link members in each group. The buttons on the right side of the display are used to set the order of the links and the direction as they will appear in the report. These settings will be saved with the group.
The report can be written as a tabulation of the individual link performance with totals in each direction as shown below or include the performance objective and show the performance compared to the objective.
Total time below level

Site 1    Site 2    Distance   RX-S1             RX-S2             Total

site-001  site-002   6.47 km   99.99992   26.5   99.99992   26.5   99.99988  38.2

site-003  site-004  17.55 km   99.99858  446.5   99.99858  446.5   99.99753 778.1

site-004  site-005   6.41 km   99.99992   25.5   99.99992   25.5   99.99988  36.7

                    30.43 km   99.99842  498.6   99.99842  498.6
Total time below level

Objectives

Reference section length    30.43 km

Annual availability (%)   99.9980

Annual unavailability (sec)   630.72
Site 1  Site 2      Distance   RX-S1          RX-S2          Total

Manatee  site-003     6.47 km   99.99992  26.5 99.99992  26.5 99.99988 38.2

                                99.99957 134.2 99.99957 134.2

    site-003 site-004    17.55 km   99.99858 446.5 99.99858 446.5 99.99753 778.1

                                    99.99885 363.7 99.99885 363.7

    site-001 Tower 23506  6.41 km   99.99992 25.5  99.99992 25.5  99.99988 36.7

                                    99.99958 132.9 99.99958 132.9


                         30.43 km   99.99842 498.6 99.99842 498.6

                                    99.99800 630.7 99.99800 630.7

    Objectives are shown in blue.
Click the Objectives button and if necessary, select the calculation method and enter the performance objectives. Note that if the specific objectives are not entered, then the report will only show the calculated performance.
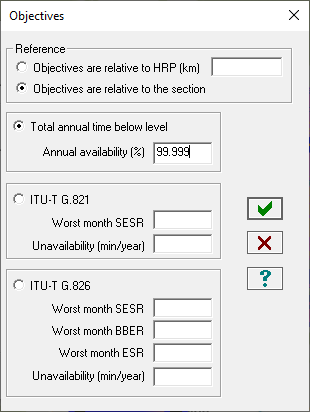
The objectives can be referenced to the total length of the selected links or to a Hypothetical Reference Path (HRP). In the latter case the reference length, in kilometers is required.
Click the ✔ on completion of the objective settings and click the report button on the initial display to generate the report.
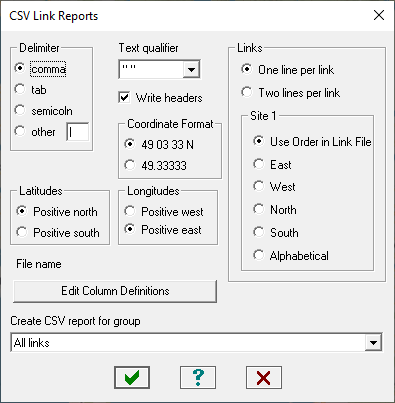
CSV Link Reports
CSV Link Reports allows the user to select the fields without any restrictions to the calculation method or application. The column order is set by the user. The row order is indeterminate if a group of links is selected. If all links are selected the order will be the same as shown in the link list. The order of the sites can be set using several criteria.
The basic report definitions (Delimiter, Text qualifier, Coordinate format, Latitude and longitude sign convention) are the same as in CSV Link Report.
The basic report format does not use the external option settings for Transmission Detail, Transmission Summary or CSV Link Reports. Click the Edit Column Definitions button to define the columns.
Column Definition Categories
The column definitions are organized into the categories shown in the drop down list in the upper right corner of the CSV Link Column Definition dialog.
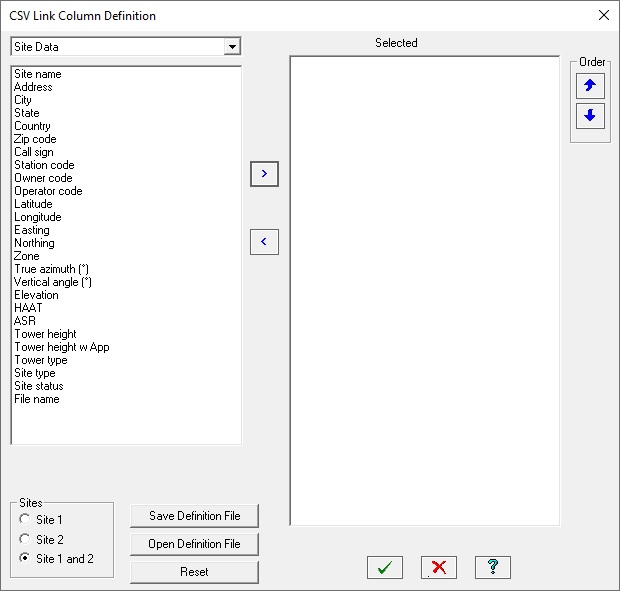
For each category, the user highlights the desired columns by dragging the mouse with the left button down over a selection, or by using the Ctrl or Shift keys. Click the arrow button to copy the highlighted items to the Selected list
If the selected categories are applicable to both sites, then the Site selection will determine if selection will be made for Site 1, Site 2 or Site 1 and 2.
Use the Sites selection and the Order buttons to set the column order in the report.
Note that the maximum number of columns in Microsoft Excel is 256 (column IV). The following guide lines are suggested to not exceed this limit.
-
If your application only uses the TR_TR antenna combination, then only select fields from the TR antennas category.
-
If your application uses both the TR_TR and the TRDR_TRDR antenna configuration and a standard report format is required, then fields from both the TR and DR antenna categories will be required.
-
If your network's link files (PL6) use a mix of multipath fade algorithms (e.g. Vigants - Barnett and ITU), only the data applicable to the specific algorithm used in the file will be printed.
-
Adaptive modulation applications will be printed using the total time below level calculation method for the reference modulation state only.
The Reset button empties the Selection list entirely. The Right arrow button will remove all selected items in the Selection list.
The Save Definition File and Open Definition File buttons are used to manage the column definitions. The file suffix CV5 is used. The last file used will be automatically loaded when CSV Link Report II is opened again.
When the column definitions are complete, click the ✔ button to close the form and click the ✔ button again to print the report.
Base Station CSV Reports
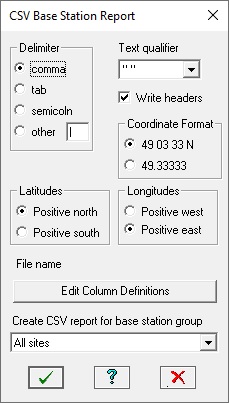
The CSV report for base stations uses the same concept as the CSV Link Report II. The following column definition categories are available:
- Site Data
- Base Data
- Mobile Data
- Sector Data
For multi-sectored antennas, the base station with the maximum number of sectors will determine the number of columns in the CSV report.
Link Reports
These reports are used in the network display under the Operations - Link Reports menu item and in all Link Design modules. Refer to the Reports section of the General Program Operation.
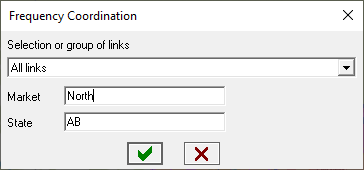
Frequency Coordination Reports
This is a two way report to request frequency assignments and to update the link files (PL6) with the actual frequency assignments.