Pathloss 6 Getting Started User Guide
This guide is intended to help new and existing users become familiar with Pathloss 6 and its capabilities. This document will cover, at a high level, the most important concepts and features used in Pathloss 6. Links to the complete documentation will be provided in most sections so that topics especially relevant to each user can be visited as needed.
Installation And Licencing Procedure
For complete details on installation and licensing procedures, please see this page:
For most users, we recommend activating online as a floating lock. This will make sure the license is available when needed, even in the case of hardware failure or theft/loss of equipment. If the online activation options are not available, it may be required to open the necessary ports in your network firewall as outlined in the above link.
Program Organization
The Pathloss 6 interface consists of two main windows: The Network Window and the Link Design Window. The Network Window is an interactive map display that allows you to view and operate on the sites and links in a network. The Link Design Window allows you to examine and tune a single link in detail.
Pathloss 6 uses a built-in, user configurable GIS System. The GIS System manages terrain data, clutter data, vector data, and defines the Site Coordinate datum and projection. The GIS System is configured from the main network display.
Radio and Antenna data files are supplied by the manufacturer and are imported into Equipment Data File Indexes in Pathloss. These indexes can then be used from anywhere in the program to add radios or antennas to sites, links, base station sectors, or other elements.
The next few sections will look at setting up the GIS System and Equipment indexes before looking in more detail at the Network and Link Design windows. The last sections will cover some of the more powerful operations such as Automated Link Design, Local and Area Studies, and Interference.
Terrain Data and GIS Configuration
Managed Terrain and Clutter Data
Pathloss 6 can automatically download and configure terrain data and clutter data from a number or sources. The following GIS data sets are currently supported in the managed system:
- STRM 1" DSM (Global)
- ASTER 1" DTM (Global)
- NED 1" DTM (North America)
- NED 1/3" DTM (USA)
- Copernicus Global Land Cover 100m (Global)
- North American Land Cover 30m (NA)
- National Land Cover Database 30m (USA)
These data sources are used together to generate the terrain heights and define the type and heights of clutter on profiles. More sources will be added as they become available.
Setup Managed GIS Data
You can select and setup the managed Terrain and Clutter models from the Startup and Defaults section of the Program Options Dialog. Click Configure - Options - Program Options or the toolbar button![]() to open the program options dialog. Select the terrain and clutter models using the radio buttons. You can also set the heights of the individual clutter categories by clicking the Edit Clutter Definition button and editing the table for the selected clutter model. You can also see the current disk usage and delete cached files to free space.
to open the program options dialog. Select the terrain and clutter models using the radio buttons. You can also set the heights of the individual clutter categories by clicking the Edit Clutter Definition button and editing the table for the selected clutter model. You can also see the current disk usage and delete cached files to free space.
Click the green check to save the options. The selected managed GIS data will used throughout the program. This selection can be changed at any time to switch between models. The data for the new model may need to be downloaded.
Downloading Managed Terrain and Clutter Data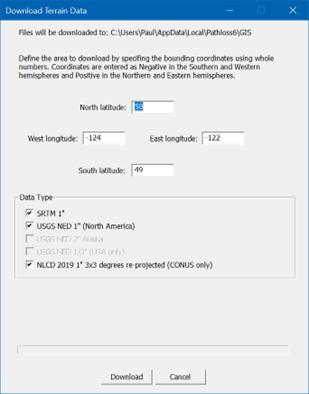
Use the mouse wheel to zoom the map to the required geographic area. Select Configure-GIS System-Download Terrain Data or press Ctrl-D or click the toolbar button![]() .
.
The dialog box will be pre-loaded with the bounding coordinates of the screen and the necessary formats selected. Click the Download button to begin. The files are downloaded locally to the user's AppData directory. This save location can be changed in the Startup and Defaults section of Program Options Configure-Options-Program Options.
Once the download is finished, the terrain data is ready to use for that area.
This process can be repeated for any area. Previously downloaded files will be skipped and the additional files will be automatically added to the system for that model. You can switch between models at any time depending on the need or location of the network.
If the automatic terrain and clutter meet your requirements, there is no need for a GIS configuration file.
GIS Configuration Files
If needed, you can create a custom GIS configuration file. This will allow you to use custom terrain, clutter, or vector data sources, or setup specific datums and projections for site coordinate entry.
The GIS file has the extension .p6g and contains the complete setup for all GIS components. The GIS files are edited, saved, and loaded from the GIS Setup Dialog box. This can be opened by clicking Configure–GIS System–GIS Setup Dialog. The current .p6g GIS filename is shown in the title bar of the dialog. The GIS Files button is used to save, load, or clear the system.
The current GIS filename is also saved in the .gr5 Network file. In this way, when a network is loaded, the associated GIS file will be automatically loaded as well.
There are 7 tabs in the GIS Configuration Dialog box. Each tab configures a specific component.
 Custom Terrain and Clutter Data
The 4 tabs, Primary DEM, Secondary DEM, Clutter 1, and Clutter 2 are used to setup the terrain and clutter sources. Depending on the Automatic Terrain and Clutter settings some of these sections may be hidden. Select Stop using Managed NED or Clutter to set to manual mode and show the controls.
GeoTIFF usage is described in the patch notes for 6.00.09: Version 6.00.09 - Pre-release
Instructions for other formats can be found in the wiki here: GIS_Overview
Please contact cte@pathloss.com for support using lidar or formats not described here.
Vector Data
For Information on using Vector files in Pathloss 6, see Vector Data
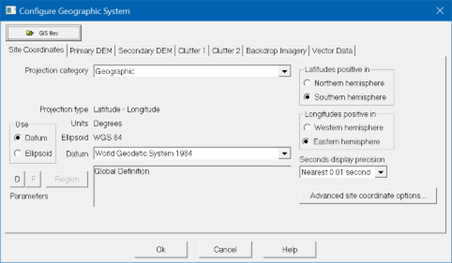
Site Coordinates
If your site coordinates are in a projection or a specific datum, this can be set in the Site Coordinates tab. This will allow you to enter the projected coordinates in the site list when adding sites.
More Information
Detailed information on manual GIS Setup can be found on this page: Geographic Information System (GIS) Configuration
Equipment Files
Pathloss can perform basic link designs and budget calculations without the need for equipment files. Basic equipment parameters can be entered manually or saved in and applied from lookup tables.
More detailed equipment parameters are distributed by manufactures as radio and antenna data files. Pathloss indexes these files so they can be accessed and applied as needed throughout the program. This section will enumerate the file formats used by Pathloss and explain how to index and work with these files.
Equipment File Formats
Both radio and antenna files come in an ACSII and binary format. The ASCII format is used when creating the file and is human readable. The ASCII file is converted to a binary format for use in Pathloss. These are the most common extensions for equipment files.
- Antenna Binary: .asd | .mas | .vas
- Antenna ASCII: .adf | .dat
- Radio Binary: .rsd | .mrs
- Radio ASCII: .raf
Equipment files in these formats can be acquired from most manufactures. Let us know if you are not able to acquire the needed files.
If you have obtained the files in binary format. You can add them directly to the index as detailed in the next section. If you only have the ASCII version, you will need to convert the file to binary first. You can also create your own equipment files. These operations will be detailed in the AntRad section.
Pathloss Equipment Indexes
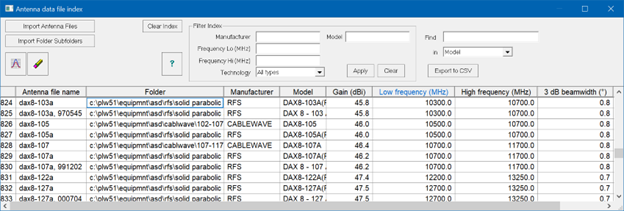
The equipment indexes are used to organize, sort, or filter the equipment files on your machine. You can open the antenna file index from the Network Window by clicking Configure – Antenna Data File Index from the menu. (The following procedure is identical for antenna and radio indexes. It will be detailed for the antenna index. The same procedure should be followed for the radio index.)
Adding Files
From the equipment index, click Import Antenna Files to open a file browser. You can browse to a folder and multi-select the antenna files to add. You can also click Import Folder Subfolder. This will allow you to select a folder. Pathloss will walk the entire folder tree below that folder and add all antenna files found.
You can click the Clear Index button to return to a blank index.
Sorting and Filtering
You can click on a column header to sort the index by that field. You can also enter text into the filter boxes and click Apply to filter the index based on the criteria provided. Click the Clear button to clear the filter and display all index equipment items.
Using AntRad
AntRad is a utility included with the Pathloss 6 installation. It can be found in the start menu in the Pathloss 6 folder. It is used to create, edit and convert equipment files.
Converting ASCII to Binary
If you have ASCII versions of an equipment file but not the associated binary file, you can use AntRad to produce it. First start AntRad and then use the Equipment type menu to select either Version 5 Radio files or Antenna Data files depending on what type of equipment you are converting.
Next, use the Convert menu item to select the operation. You will select the format and whether to convert selected files or an entire folder tree. Finally select the files or folders you would like to convert. If you are converting folders, the binary files will appear in the same folder as the ACSII file.
Creating or Editing Equipment Files
AntRad can also be used to create equipment files from scratch.
Complete details of the equipment file formats, and AntRad Operation can be found here: AntRad
Network Window
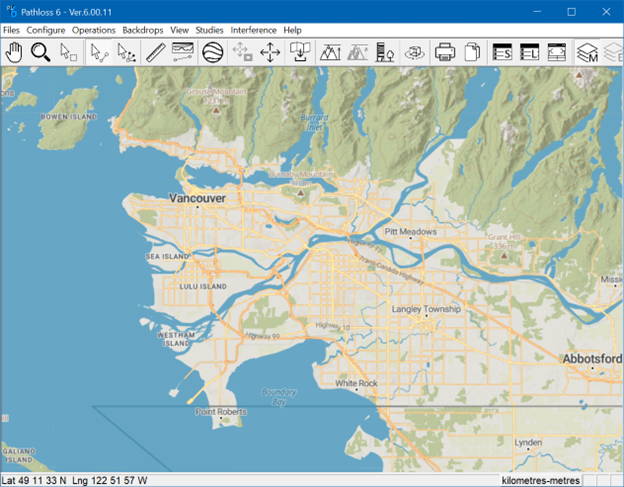
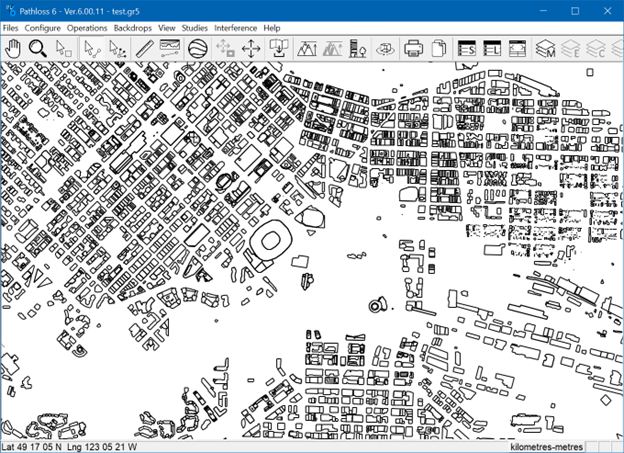
The network window is the main program window that is shown when you start Pathloss 6 normally. This window is used to view, organize, and operate on sites, links, base-stations, and other network elements.
Units Setting
The unit setting is displayed in the status bar at the bottom of the window as kilometers-meters or miles-feet. Clicking on this pane in the status bar will change the unit system globally throughout the program. This can also be done by clicking the units in the Link Design Window status bar.
File Formats
There are 2 main file types that Pathloss 6 works with:
- Link Files (.plz |.pl6 | .pl5 | .pl4) – Each link file represents a single link. The Link File contains all information relevant to the link including site coordinates, radio and antenna parameters, path profile, calculation options, and results from completed calculations. This file is intended to be self-contained and portable. The .plz format is new to Pathloss 6. It is an extensible Link File that can contain additional related data. This format is used for multiband links and for passive links
- Network Files (.gr5 | .gr4) – A Network File contains sites, links, base-station definitions, groups, studies, colors, and display settings. Each link in a network may reference a Link File on the computer that contains the complete link data. The Network File may also contain a reference to a .p6g GIS file. If so, this GIS file will be loaded when the network file is loaded.
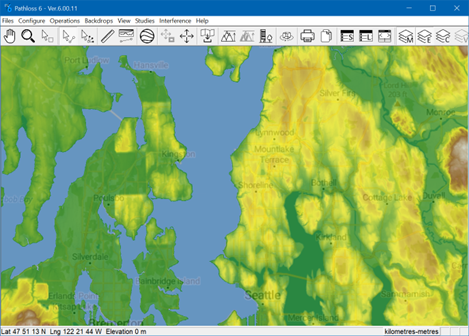
Navigating
Click and drag anywhere on the map to pan the display. Use the mouse wheel to zoom in on the cursor position. You can hold shift to switch to the zoom cursor and you can click and drag a rectangle to zoom to. There are also dedicated zoom and pan tools on the toolbar. Finally, there is the zoom to extents toolbar button which will zoom the display to the extents of the current network.
Adding Existing Link Files to a Network
To add existing link files to the network:
- Click Files-Import Link File from the main menu or press Ctrl-W. This will bring up a file open dialog. You can multi-select any number of Link Files and click Open to bring them in to the network.
- You can also click and drag Link files from the desktop or explorer window on to the Pathloss network window. If a single link is added it will automatically be opened for design. Otherwise, the links will just be added to the network.
- Finally, you can double click on a Link File to open it in the Link Design Window. From here you can click Files-Add to Network to add the link to the current network.
These operations can also be used to update an existing link in the network with a new file path. For example if some .pl5 files were moved to a different folder, importing them in to a network that contains those links would update the associated file path to the new location.
Adding Sites to the Network
To add sites to the network:
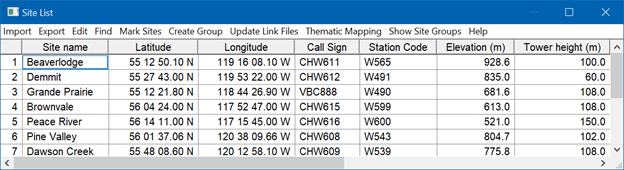
- From the Site List – Click View-Site List (Ctrl-S) to bring up the Site List. You can manually enter site names and coordinates into the appropriate fields. Once a site row has a name and coordinates, the site is added to the network. (Note the coordinates of sites must be unique. A site entered with duplicate coordinates will not be added to the network).
- From the Network Display – Click Operations-Add Site to bring up the Add Site Dialog. You can now click on the map display to select the location for the new site. Then click the + button in the dialog box to add the new site.
- Import From a Text File – Pathloss 6 has a powerful text import routine that allows you to define an import for many csv layouts. See this page for complete information on Site Text Import: Import Sites From a Text File
Adding Links to the Network
To create new links and link files from the network:
- Manual Creation – Select the PTP link tool. Click on a site and drag to another site and release to create a new link. This will be an empty link that is not associated with a Link File. Once the link is designed and saved, the link file will be associated with the link in the network.
- Import from Text File – The link text import is accessed from the site list and is a robust operation that can bring in many link parameters and assign radio and antenna files. Full details on this operation can be found here: Import Links From a Text File
- Create P2P Links – Finally, the automatic link designer can be used to create links between groups of sites. This operation is detailed in the automatic design section later in this document.
Working With Sites and Links
Opening Links
 Select the P2P Link Tool from the toolbar. Left click on a link with the P2P tool to bring up the design section menu. Select one of the design modules to open the link in the Link Design window. (Only the Worksheets and Terrain Data modules will be available if the link does not have a profile.)
While the link is open in the design window it will be shown in the network with a green highlight. The link design window can be closed at any time either saving or losing changes. Opening a new link in this way will prompt to save and close and currently open Link Design Window.
New Blank Link Window
You can open a blank Link Design Window by clicking Files-New Link Window (Ctrl-Q). This will bring up a blank link window that can be filled out directly. This type of operation can be used for testing purposes or coordinates can be supplied to create a valid link. A completed link can be added into the network by clicking Files-Add to Network.
Selections and Groups
Sites and Links can be added to groups for organization and for use in batch operations. You can create an unlimited number of groups which can contain any number of sites and links. Sites and links can belong to any number of groups. Click Configure-Groups-Add Edit to open the Groups Dialog box. This box can be used to create groups and add sites and links from a list or by clicking on the network display.
Groups can also be used to hide sites or links on the network display. Click Configure-Groups-Set Visibility to set which groups should be visible on the network display.
 Selections act as a temporary group and can be used anywhere groups are. To create a selection, use the selection tool and click or drag across elements to add. You can also Ctrl-click to add elements to the current selection. Click on empty space with the selection tool to clear the selection.
Groups are an important part of working with larger networks. Full details on group operation can be found here: Groups_and_selections
The Site and Link Lists
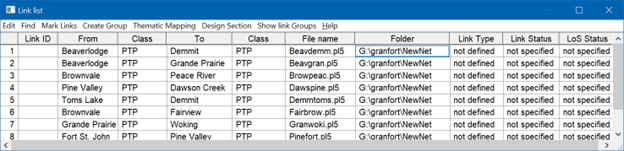
 The Site and Link lists allow you to view all the sites and links in the network in a grid that can be sorted and selected from. Click View-Site List (Ctrl-S) or View-Link List (Ctrl-L) to open the respective list. There are also toolbar buttons for each list. (The Link List will not display if there are no links.)
From the Site List, you can manually add new sites by typing in names and coordinates. You can also edit other parameters directly in the Site List. Not all site parameters are shown in the grid. You can right click on a row and select Edit to see additional parameters such as projected coordinates.
The Link List data is not directly editable. It can be used to see what links have associated link files and where those files are located on the machine or network. You can also open a Link in the design window from here by clicking on the row and then selecting from the Design Section menu.
Both lists also allow you to click in the leftmost column to select a row. Shift click to select a range of rows and Ctrl-click to add to the selection. With the marked rows you can click Create Group to add the rows to a group or click Mark Sites to create a selection.
Pressing Delete will delete the current or selected sites or links. Pressing Esc will close the window.
More on the Pathloss Site_List
More on the Pathloss Link_list
Default Calculation Options
Every Link File in Pathloss contains its own set of calculation options that can be independently edited. There is also a set of default calculation options. The default calculation options are used when you create new links by opening a new link window, opening a new link from the network, or by importing a text file.
The default calculation options are edited from the Network window by clicking Configure-Options-Default Calculation Options. Detailed descriptions of the calculation options can be found here:Calculation Options
Backdrop Layers
Map Layer
By default, Pathloss downloads and displays tiled map backdrop imagery. You can select between a few different styles using the menu Configure-GIS System-Network Display-Map Style. There is a terrain, street map, and satellite style. You can turn the map backdrop off by clicking the toolbar map layer toggle button.
Note that there is a menu item to disable the map system entirely: Configure-GIS Setup-Network Display-Use Tiled Map Backdrop. It is recommended to leave the option checked. If this is unchecked, the maps will not show and the projection of the display will change to the Version 5 style Transverse Mercator. This projection is only suitable for networks of a certain size. If the east west extent of the network is too large, distortion will appear.
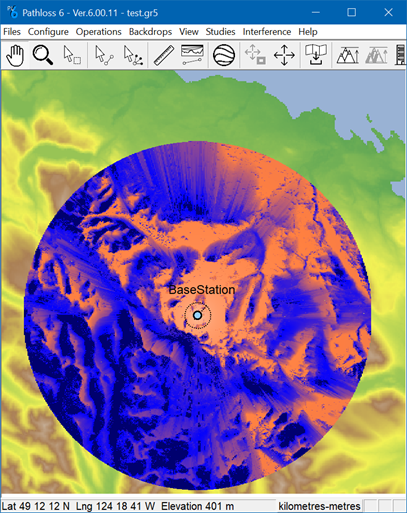
Elevation Backdrop
 Click on the elevation Backdrop toolbar button to generate a colored image showing the elevations of the area on the screen. If the operation fails, you may need to download terrain data (Ctrl-D or see above) The resolution matches that of the screen so the backdrop can be regenerated at higher zoom levels.
 The backdrop can be hidden by clicking the elevation backdrop layer toggle toolbar button. The colors of the backdrop can be edited in the color ramp dialog as shown below.
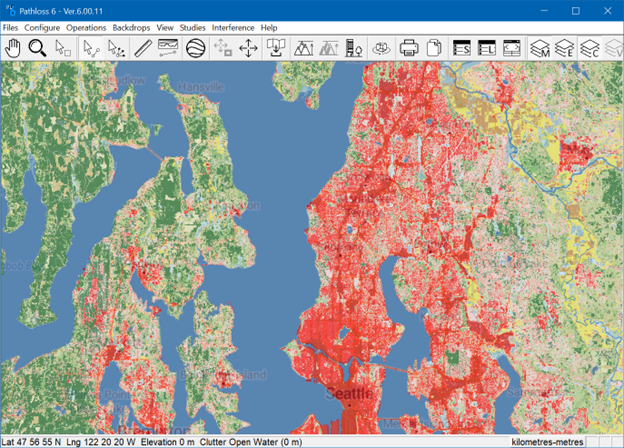
Clutter Backdrop

 If there is a category type clutter database configured for the Clutter 1 tab (NLCD for example) you can generate a clutter backdrop showing the land use. Click the clutter backdrop button to generate the image. This works the same as the elevation backdrop and can be toggled on and off with the associated toolbar button.
Vector Display
If vector data has been configured in the GIS system, it will also be shown on the display. The vector colors and line styles are set in the vector definition section in the GIS system. The vectors can be toggled on or off with the vector layer toolbar button.
Extents Layers Dialog
Click View-Extents Layers to see the Extents-Layers dialog. Here you can control the visibility of each of the layers above as well as customize the transparency of each layer discussed above. In addition, the transparency and visibility of studies can be adjusted here.
Colors and Customization
Right click on a link and select Link Attributes. This box allows you to change the line style, color, and thickness of a single link. Likewise for sites, right clicking and selecting Site Attributes allows you to change the shape, color, and size of the site marker. You can also right click on a link and select Link Labels to define a label for the link that will be shown on the network display.
 Display Options and Batch Attribute Modification
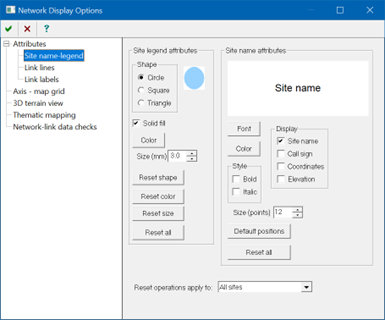
Click Configure-Options-Network Display Options or click the toolbar button to bring up the display options window. Under the attributes topic on the left you will find three sections corresponding to the attribute sections above. These sections allow you to change the default attributes for any new links and sites.
You can also use these sections to modify the attributes of all sites and links or a group or selection. First set the Reset operations apply to: drop-down box to either All Sites/Links or a group or selection to modify. You can then press any of the “Reset” buttons to modify the appearance of all sites and links in the selected group (or All Sites / Links) in the drop-down box.
All of the options dialogs can be exited by pressing Esc.
Color Ramp Dialog
Often in Pathloss a range of numbers needs to be assigned to a range of colors for useful display, eg. the elevation backdrop, auto design link colors, and area study colors. Click Backdrops-Elevation Color Ramp to see the color ramp for elevations. Other color ramps work similarly. There are a number of color markers to the right of the color ramp example. You can click and drag these markers to move them up and down. Double click on the color markers to change the color. Double click on an empty space to add a marker. Click and drag a marker off to the right to remove it.
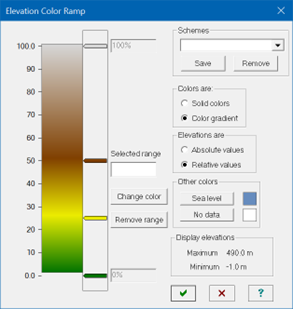
You can select to display the colors as a gradient or with a solid fill and you can select between relative and absolute ranges. In the case of absolute ranges you would enter the elevations for the top and bottom of the color ramp in the edit boxes in those locations. You can also set values for sea level and no data.
Finally you can save a color ramp by entering a name in the Scheme box and clicking Save. Previously saved schemes can be loaded by selecting them in the drop-down list.
For more information see: Elevation_color_ramp
Link Design Window
The Link Design window is used to edit and examine all aspects of a single PTP or PTMP link in detail. There are 5 design sections that are accessed from the Design menu: Worksheets, Terrain Data, Antenna Heights, Diffraction, and Specular Reflections. Each of these modules has a custom display and menu suited to the type of work and calculations. The link design window can also produce a number of general and specific reports in a customizable RTF format.

Calculation Options
Each link file contains its own set of calculation options. You can click Configure-Options-Calculation Options to edit the options for this link. In the Worksheets module, clicking on the algorithm names in the status bar will also bring up the calculation options. Detailed descriptions of the calculation options can be found here: Calculation Options
All of the options dialogs can be exited by pressing the Esc key.
Transmission Analysis
The Transmission Analysis module is used to assign equipment specifications such as radio, antenna, ACU, and TX Line values as well as other values such as channel assignments, climatic parameters, site information, and rain figures. This module also provides a summary of results and has the operations for working with XPIC and multiband.
Using the Data Entry Worksheets
Clicking on many of the icons on the display will bring up a data entry worksheet for that component. You can enter data directly in these worksheets and the change will be immediately reflected in the results. Some cells will have blue arrows next to them. Clicking the blue arrow will attempt to autofill the cell from the relevant database.
You can click on the following areas:
Path Profile
The path profile worksheet allows you to view the path metrics as well as set important climatic information used in the multipath calculation.
The multipath parameters shown will depend on the multipath algorithm selected in the calculation options. If the link has coordinates, the blue arrows can be clicked to auto populate many of the cells from climate databases.
Diffraction loss can be applied here as well. Click the blue arrow next to diffraction loss to see the results for different values of k and click the green arrow to apply the result.
Rain Cloud
The rain worksheet allows you to set the values used in the rain calculation. The appearance of this worksheet depends on the rain method selected in the calculation options. If the link has coordinates, the blue arrows can be used to auto populate the cells from various rain databases.
Radio, ACU, TX Line, and Antenna
Clicking on one of the equipment icons will bring up the worksheet for that component. Here you can enter the parameters for the specific equipment on the link.
 Each of these worksheets has an index button that you can use to populate from an index. For the Antenna, Radios, and TX Lines the equipment data file index will be displayed. Clicking this button in the ACU worksheet will populate the ACU from configurations in the radio file if they exist.
 The radio worksheet also has a TR button that allows you to select different radio power and receive threshold options. For ACM radios this button allows you to select active modulation states and set the reference modulation state.
 Finally, there is a view button which shows detailed parameters and curves for the current radio or antenna.
TX channel button
The channels worksheet allows you to enter the channels and polarizations used by this link. These specific frequencies are used for the interference calculation or to supply frequency diversity spacing.
You can click the index button to bring up the frequency plan grid. The frequency plan can be filled out manually or loaded from the included frequency plans (found in the Pathloss 6\equipmnt\ folder).
 There is also an ATPC button that will populate the ATPC values from those in the radio file if provided.
Site Names
Clicking the site names in the status bar will bring up the Site information worksheet. Changing values here may cause a data discrepancy between the network and link file if the link is in the network. Pathloss will prompt to resolve the discrepancy when the file is saved.
More Info: Antenna Data Entry Form
Status Indicators
 Calculations will begin to appear as soon as enough information is available. If the calculation does not appear, you should check the status bar indicators to see what is missing. There is a warning indicator and an error indicator in the status bar. If either one of these is not a green check, you can click on it to get a description of the problem.
Working With Adaptive Modulation Radios
Adaptive modulation links require a radio file. The radio file contains all the parameters for the various modulation states. The calculation options for a link must first be set to Adaptive Modulation in the calculation options for the link. Open the calculation options to the Application Radio Type section and set the Application type to Adaptive Modulation.
Another important option is called Display Format. If this option is set to Summary display for all modulation states, the output will be a table showing all the activate modulation states. Otherwise, detailed results for the reference state will be shown. The active modulation states and reference state is defined when you assign the radio file from the index. This setting can be revisited by clicking the TR button in the radio worksheet.
Configuring for Space and Frequency Diversity
To activate space diversity, you will first change the antenna configuration by clicking Configure-Set Antenna Configuration. Select the configuration TRDR-TRDR to add diversity antennas to each side of the link. The worksheets display will change to show the additional antennas. You can then click on these antennas to apply an antenna file or enter the parameters.
Once the parameters including antenna heights have been entered, the space diversity calculation will be enabled, and the additional results will be displayed.
Frequency diversity can be enabled by clicking Operations-Diversity Parameters and filling in a separation. (Or you can choose to determine the spacing from the channel table.)
If both frequency diversity and space diversity are enabled, quad diversity results will be shown.
Using XPIC Radios
Click Operations-Co-channel (XPIC) Operation to bring up the Co-channel Interference worksheet. The worksheet will be filled out with the necessary values from the equipment files if available (Antenna XPD and XPIF). Double click on Enable co-channel operation to activate the operation and calculate the effect of co-channel operation. The exact form of the results will depend on the XPIC method selected in the calculation options.
For purposes of interference, each channel used as XPIC should be duplicated in the channel table with the opposite polarization. This behavior will be updated in the future.
Multiband Operation
Multiband Operation involves operating multiple frequency bands over the same path. Each band contains its own set of equipment and calculation parameters. The results from each band can be combined in a Carrier Aggregation analysis.
Please see the Multiband section in this link for full usage details: Multiband
Transmission Analysis Module Documentation: Transmission Analysis Overview
Terrain Data
The terrain data module is used to generate a profile from the configured GIS sources or to edit a profile or to create one from scratch for testing purposes.
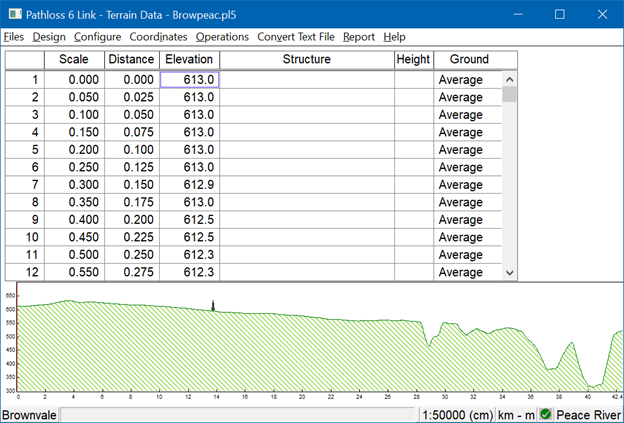
To generate a profile on a link with coordinates click Operations-Generate Profile. A dialog showing the available DEM and clutter databases will be shown. Click the green check to generate the profile using the selected databases.
You can edit the profile by typing values directly in the terrain point listing. You can add structures by double clicking in the structure column and selecting the structure and height.
Terrain Data Module Documentation: Terrain Data Overview
Antenna Heights
The Antenna heights module is used to set the antenna heights and view detailed clearance metrics.
Click Operations-Set Clearance Criteria to set the clearance criteria that will be used when calculating antenna heights. Click the calculator button to calculate lowest heights that meet the clearance criteria.
The antenna heights can be entered manually in the edit boxes. The arrows will adjust the height by the selected increment. Click on a diversity height or click the divr radio button to edit diversity heights.
To view detailed clearance information at a specific location, click on the profile to mark a point. The arrow keys can be used to move the marker by individual terrain points for fine selection. Click on the status bar where the distance is shown to bring up a detailed clearance report for that point.
Clicking the wrench of leaving the module will prompt to finalize the heights.
Antenna Heights Module Documentation: Antenna Heights Overview
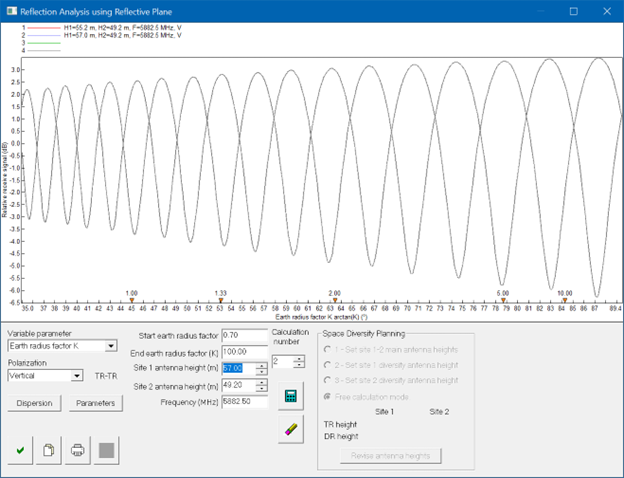
Specular Reflections
The specular reflections module is used to test a path for specular reflections, calculate the reflection point location, and determine optimal antenna heights for space diversity protection.
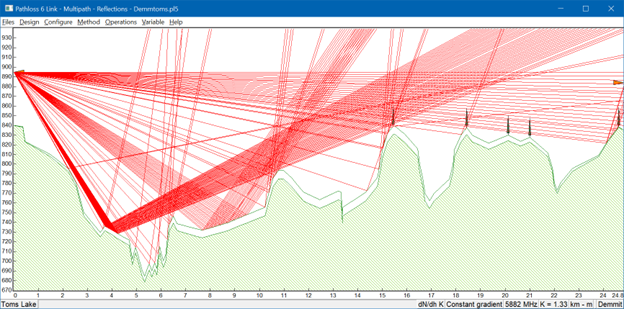
See the documentation for the complete procedure for testing and protecting against specular reflections: Specular Reflections - Ducting Overview
This module can also be used to examine the effects of variable K gradients including ducting. Because of the statistics and short time frame of these events, they are not considered outside of this module.
Diffraction
The Diffraction module is used to examine diffraction loss in detail. From this module a visual representation of the horizons and angles used in the diffraction calculation can be seen. You can switch between diffraction algorithms and options using controls on the tool bar to compare results.
Click the calculator button to show the results.
Diffraction Module Documentation: Diffraction Overview
Reports and Exports
Pathloss produces many kinds of reports. Most reports are generated in an RTF format that is fully compatible with all major word processors. Pathloss can also produce CSV reports and other exports such as Google Earth kml.
RTF Reports
Various RTF Reports can be produced from many places in the program. Most modules in the link design window have a Reports menu to produce the available reports. For example, in the Transmission Analysis module, the Report menu is used to create the very common Transmission Detail or Transmission Summary Report.
Reports Documentation: Reports
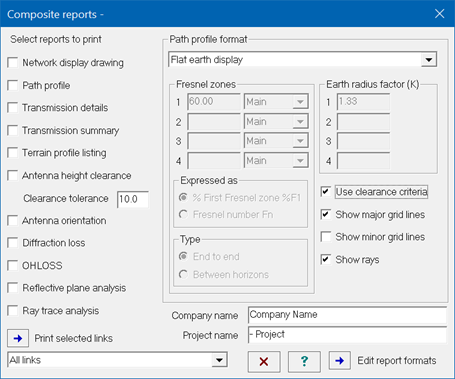 Composite Reports
The various RTF reports can be combined into a single composite report. You can do this for a single link from the Link Design Window by clicking Design-Reports. This will bring up the Composite Reports dialog that will allow you to view individual reports and mark them to me included in the composite report. Check the boxes next to the reports to be included in the composite report, then click the Print selected reports button. There are also options here for how to display the path profile and fresnel zones.
Composite reports can also be generated for multiple links in a network. From the Network Window, click Operations-Link Reports. This will bring up a similar dialog to the one used in the Link Design window. The only difference is the drop-down list that allow you to select the Group or Selection of links to create the reports for. In this way the composite reports for any number of links can be generated in one operation.
Transmission Detail and Transmission Summary Reports
The Pathloss transmission detail and transmission summary reports are widely used to share link prediction results. The summary report also includes a profile picture as well. These contents of these reports can be customized in the Program Options dialog.
Click Configure-Options-Program Options or press the toolbar button. There is a large topic on the left called Transmission Report Format that contains a number of subtopics. Selecting one of these topics will display a series of checkboxes for a particular calculation method (or the common fields). There is a drop-down list to set which report you are defining. Any fields that are checked will appear in the report if there are valid results.
Customizing RTF Reports
The RTF Reports can be customized with a user designed header and footer. Click Configure-Options-Program Options. Select Report Layouts from the bottom of the screen. You can then select the report to customize from the drop-down list. Click Edit RTF template file to bring up the RTF editor. Instructions for editing the header and footer are found in the document body.
CSV Reports
Pathloss uses a powerful customizable CSV report to export selected parameters from any number of links in a network. This report is useful for transferring or processing large amounts of data. Click Operations-Reports-CSV Link Reports to bring up the dialog.
There are some options for the CSV report in the dialog box, but the first step will be to define the CSV columns. Click Edit Column Definitions to bring up the column definition box. All possible fields are shown on the left under different heading. Select the fields you want to appear in the report and move them to the right with the arrow buttons. The radio buttons at the bottom are used to set for which site the field applies. The fields can be selected and sorted using the up-down arrows on the right.
Note that there are special Modulation State categories that are handled a little different. fields from these categories will always appear at the end of the row. This block of fields will be duplicated for each active modulation state in the link.
Google Earth Export
The network, including sites, links, Fresnel zones and studies can be exported to Google Earth. Click Files-Export-Google Earth. You can choose which elements to export. Be aware that exporting a large number of links with Fresnel zones could lead to a very large kml file with poor performance.
Automatic Link Design
Pathloss contains powerful routines for automatically designing links based on link design rules. This can be used to examine all possible connections between a group of sites, designing a layout of links, or modifying existing links with different equipment or options.
Link Design Rules
 At the heart of the automatic design operation is the link design rules file. This file contains equipment parameters, calculation options and instructions for setting antenna heights and optimizing the link. The link design rules are access from and of the design sections described below. Link design rules files can be saved and loaded from the Link Design Rules dialog. You may wish to create many link design rules files corresponding to different frequency bands or equipment profiles. Note that different link designs are used for PTP or PTMP design and the link design rules files are not interchangeable.
Full details on the link design rules can be found here: Point to Point Link Design Rules
In all the methods detailed below, study links are first created by clicking the Create Links button. These temporary links can then be examined and rejected as needed. When you are happy with the results you will click Finalize links to create or update the .pl6 files. Exiting the dialog before this will cancel the operation and leave the network untouched.
Create P2P Links
This operation will create links between a group of sites. The links are color coded according to a number of criteria. The study links can then be rejected base on a number of criteria to quickly determine possible network layouts. Click Operations-Create P2P Links to begin the operation.
Design Links
This operation will design links defined in the network. Links involved in this operation must not have an associated link file. If a group is used for the operation, all link in the group must satisfy that criterion.
Edit Modify Links
This operations works with existing links that have a Link File associated. The links involved can be color coded according to the existing setup and then modified and recolored using the design rules. The scope of the design rules is especially important to consider in this case so that unintended modifications are not applied.
PTMP and Local Studies
Pathloss 6 models PL6C or PL6T introduces Base stations to the network display. Base stations are used to create PTMP links and Area Studies.
Base Stations
Base stations are created at a site and contain all the equipment and sector information necessary to generate studies and links. Right click on a site and select Base Station-Add Edit to create or modify a base station. The base station information is saved in the network .gr5 file. Full details on creating a base station can be found here: Base - Mobile Equipment Specifications
Designing PTMP Links
There are 2 ways to design PTMP links. Both methods use the automatic designer described above to apply the base station equipment and parameters to the link file.
Point to Multipoint Link Design Rules
To create multiple links from a base station, you can right click on a base station and select Create PTMP Links. This will open a PTMP link design window that works very similar to the Create P2P links operations. There is an option to set a radius of sites to include rather than a group. Clicking the link design rules button will show the PTMP rules that will be used. Click Create and then Finalize to produce the links.
Create Point to Multipoint links
A single PTMP link can also be created using the PTMP tool. Select this tool and then drag a link from the base station to the remote site. This will be registered in the network as a PTMP link. The first time you click on this link and select Transmission Analysis, you will be prompted to design the link. Click Yes and Pathloss will use the current PTMP link design rules to apply the equipment and parameters to the link.
Local Studies
Pathloss can generate a coverage study showing a heat map or other display covering the area. To create a local study, right click on a base station and select Local Study-Create Edit. You can enter a radius or click on the blue icon to click on the network window to set the radius. Then enter a cell size to determine the resolution of the study. Between the radius and cell size a number of row and columns is determined. Pay attention to the number of rows and columns as this will determine the number of radials requires and the amount of time the study will take.
Click Generate Local Study to create the study. The colors and display criteria of the study can be changed by clicking Studies-Local Studies-Display Criteria. This will allow you to set the colors of the study and switch between different display criteria such as receive signal or LOS.